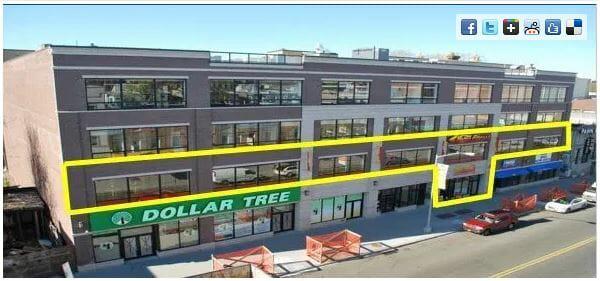
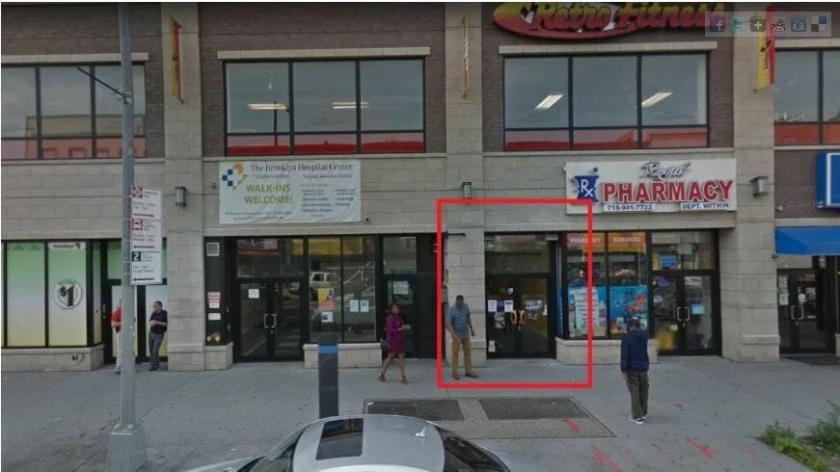
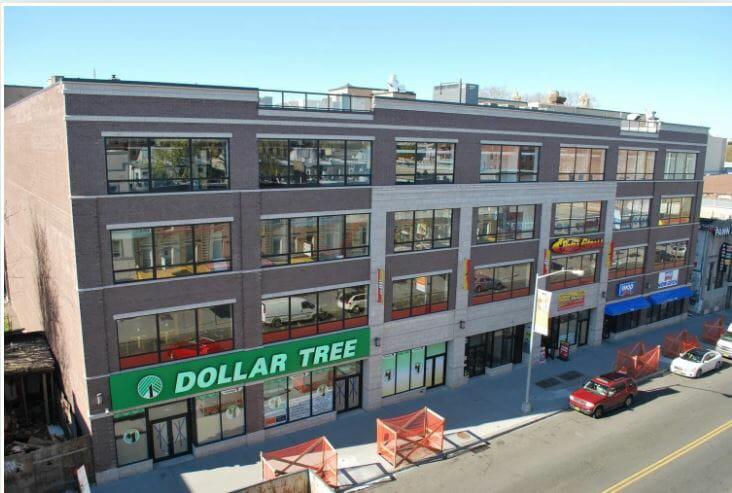
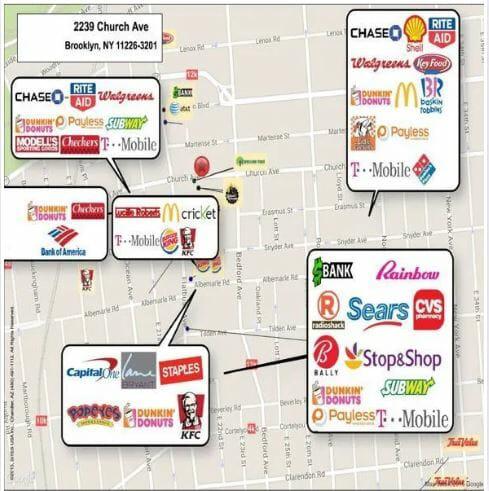
1-Mile | 3-Miles | 5-Miles | ||
---|---|---|---|---|
Total Population | 172,948 | 1,281,979 | 2,647,685 | |
Population Median Age | 37 | 37 | 37 | |
Population by Age | 0-9 Yrs | 21299 (12%) | 178503 (13%) | 358832 (13%) |
10-19 Yrs | 19345 (11%) | 150030 (11%) | 300792 (11%) | |
20-29 Yrs | 28426 (16%) | 203017 (15%) | 429344 (16%) | |
30-39 Yrs | 29340 (16%) | 207239 (16%) | 428591 (16%) | |
40-49 Yrs | 22716 (13%) | 162793 (12%) | 332711 (12%) | |
50-59 Yrs | 20017 (11%) | 148902 (11%) | 309380 (11%) | |
60-69 Yrs | 17439 (10%) | 124771 (9%) | 256855 (9%) | |
70+ Yrs | 14365 (8%) | 106723 (8%) | 231179 (8%) | |
Median HH Income | $55,383 | $58,046 | $56,951 | |
Total Household Income | < 24K | 14810 (22%) | 114331 (24%) | 252069 (26%) |
25-49K | 15219 (23%) | 93568 (20%) | 189788 (19%) | |
50-74K | 12000 (18%) | 70734 (15%) | 139990 (14%) | |
75-99K | 8394 (12%) | 53173 (11%) | 105736 (10%) | |
100-199K | 11613 (17%) | 94561 (20%) | 196934 (20%) | |
200K+ | 3303 (5%) | 39101 (8%) | 83421 (8%) | |
Highest Education Level | No Diploma | 17869 | 150945 | 342649 |
Diploma or GED | 35681 | 218992 | 458385 | |
Some College | 20082 | 122926 | 241842 | |
Assoc. Degree | 7547 | 53063 | 109032 | |
Bachelors Degree | 23998 | 188812 | 396328 | |
Higher Degree | 15222 | 135401 | 263008 | |
Total Housing Units | 70,992 | 506,635 | 1,055,043 | |
--Owner-Occupied | 11,822 | 139,927 | 288,245 | |
--Renter-Occupied | 53,515 | 325,542 | 679,693 | |
Owner-Occupied Values | < 100K | 491 | 4539 | 10912 |
100-199K | 343 | 3719 | 9567 | |
200-299K | 638 | 5996 | 15073 | |
300-399K | 1609 | 11593 | 23413 | |
400-499K | 1816 | 17159 | 32408 | |
500K+ | 6925 | 96921 | 196872 | |
Total Working Age Population | 139,701 | 1,009,228 | 2,102,777 | |
In Work Force | 92,541 | 653,325 | 1,339,682 | |
Not In Work Force | 47,160 | 355,903 | 763,094 | |
Workforce Employed | 85,984 | 608,476 | 1,247,052 | |
Workforce Unemployed | 6,543 | 44,639 | 91,948 | |
Civlian Workforce | 92,526 | 653,115 | 1,339,000 | |
Military Workforce | 14 | 210 | 682 | |
Total Households | 65,338 | 465,469 | 967,938 | |
Family Households | 38,637 | 286,170 | 595,228 | |
Non-Family Households | 26,700 | 179,299 | 372,710 | |
Married Couple | 18,463 | 171,363 | 366,151 | |
Other Family | 20,174 | 114,807 | 229,077 | |
Married w/Child | 8,322 | 80,622 | 165,847 | |
Single Male w/Child | 1,213 | 8,021 | 16,680 | |
Single Female w/Child | 6,394 | 36,837 | 74,981 |
Population Change Last Two Decades - Plus Projection
2000 | % | 2010 | % | 2020 | % | 2030 | |
---|---|---|---|---|---|---|---|
New York | 18,976,457 | +2 | 19,378,102 | +4 | 20,146,131 | +2 | 20,604,030 |
Kings County | 2,465,326 | +2 | 2,504,700 | +9 | 2,738,283 | +5 | 2,863,996 |
Queens County | 2,229,379 | 0 | 2,230,722 | +9 | 2,436,549 | +5 | 2,565,268 |
New York County | 1,537,195 | +3 | 1,585,873 | +6 | 1,688,894 | +2 | 1,727,631 |
Total Working Age Population:
Total Households:
Total Working Age Population:
Total Households:
Total Working Age Population:
Total Households: