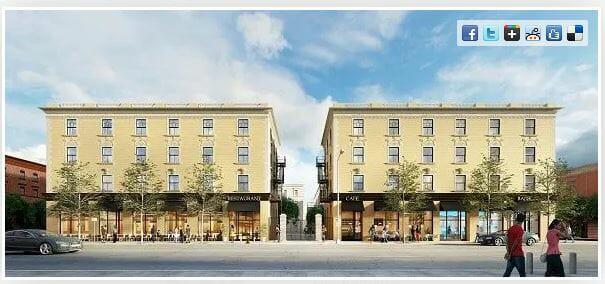
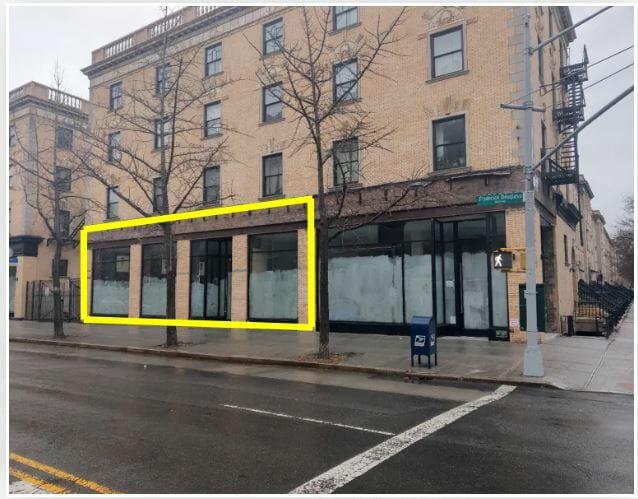
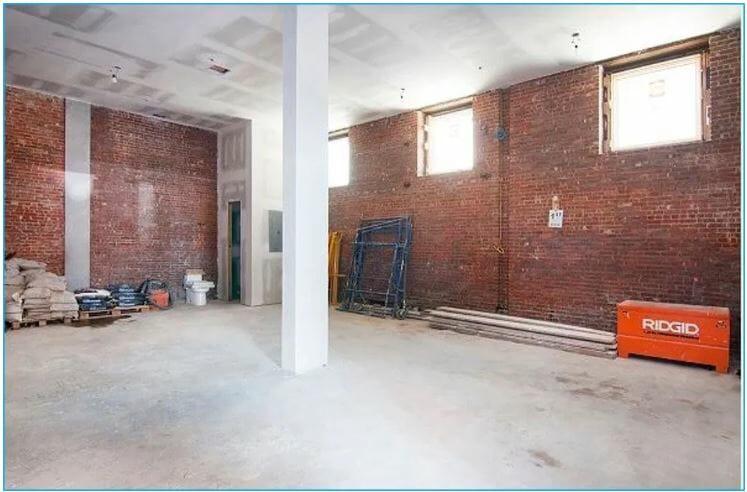
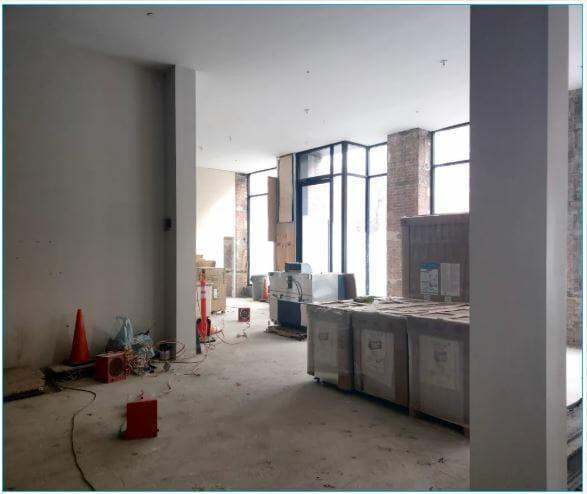
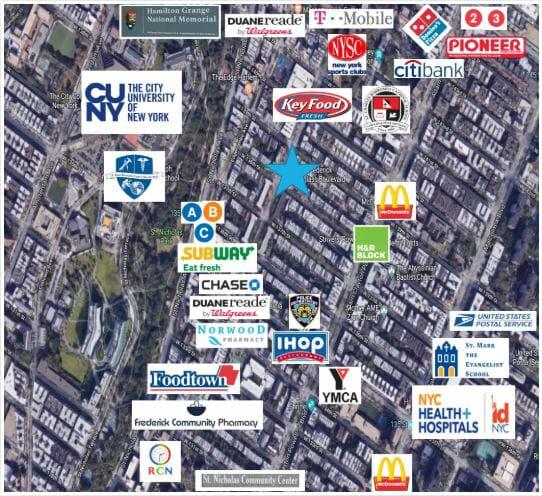
1-Mile | 3-Miles | 5-Miles | ||
---|---|---|---|---|
Total Population | 207,890 | 1,260,440 | 2,559,199 | |
Population Median Age | 37 | 37 | 38 | |
Population by Age | 0-9 Yrs | 23635 (11%) | 152243 (12%) | 304960 (11%) |
10-19 Yrs | 20659 (9%) | 142789 (11%) | 271791 (10%) | |
20-29 Yrs | 42250 (20%) | 221080 (17%) | 437868 (17%) | |
30-39 Yrs | 35933 (17%) | 199291 (15%) | 427262 (16%) | |
40-49 Yrs | 25674 (12%) | 158929 (12%) | 321910 (12%) | |
50-59 Yrs | 25633 (12%) | 154658 (12%) | 311933 (12%) | |
60-69 Yrs | 18045 (8%) | 117814 (9%) | 241820 (9%) | |
70+ Yrs | 16061 (7%) | 113636 (9%) | 241656 (9%) | |
Median HH Income | $44,169 | $47,526 | $54,973 | |
Total Household Income | < 24K | 27365 (32%) | 158518 (32%) | 291146 (28%) |
25-49K | 17027 (20%) | 93208 (19%) | 189049 (18%) | |
50-74K | 12111 (14%) | 65578 (13%) | 143747 (14%) | |
75-99K | 8450 (10%) | 45082 (9%) | 99907 (9%) | |
100-199K | 13144 (15%) | 78132 (15%) | 182508 (17%) | |
200K+ | 4845 (5%) | 49188 (10%) | 118014 (11%) | |
Highest Education Level | No Diploma | 29502 | 197030 | 366147 |
Diploma or GED | 32199 | 177800 | 365440 | |
Some College | 21191 | 114206 | 237464 | |
Assoc. Degree | 8226 | 45980 | 97594 | |
Bachelors Degree | 30019 | 181515 | 405478 | |
Higher Degree | 24465 | 153487 | 328245 | |
Total Housing Units | 90,620 | 533,206 | 1,142,843 | |
--Owner-Occupied | 9,955 | 85,663 | 216,931 | |
--Renter-Occupied | 72,987 | 404,044 | 807,441 | |
Owner-Occupied Values | < 100K | 932 | 5922 | 11830 |
100-199K | 461 | 3963 | 12991 | |
200-299K | 946 | 6502 | 16400 | |
300-399K | 1079 | 8546 | 22204 | |
400-499K | 1033 | 8496 | 23326 | |
500K+ | 5503 | 52233 | 130179 | |
Total Working Age Population | 171,591 | 1,023,897 | 2,092,659 | |
In Work Force | 109,214 | 632,483 | 1,338,095 | |
Not In Work Force | 62,377 | 391,415 | 754,564 | |
Workforce Employed | 100,022 | 579,167 | 1,232,672 | |
Workforce Unemployed | 9,192 | 53,155 | 104,824 | |
Civlian Workforce | 109,214 | 632,322 | 1,337,496 | |
Military Workforce | 0 | 161 | 599 | |
Total Households | 82,942 | 489,706 | 1,024,372 | |
Family Households | 41,197 | 272,353 | 560,820 | |
Non-Family Households | 41,744 | 217,353 | 463,552 | |
Married Couple | 16,518 | 134,176 | 305,251 | |
Other Family | 24,679 | 138,178 | 255,569 | |
Married w/Child | 7,610 | 57,242 | 126,903 | |
Single Male w/Child | 1,425 | 9,268 | 18,904 | |
Single Female w/Child | 8,526 | 53,543 | 99,577 |
Population Change Last Two Decades - Plus Projection
2000 | % | 2010 | % | 2020 | % | 2030 | |
---|---|---|---|---|---|---|---|
New Jersey | 8,414,350 | +4 | 8,791,894 | +4 | 9,132,700 | +4 | 9,530,900 |
Bergen County | 884,118 | +2 | 905,116 | +7 | 967,500 | +7 | 1,031,500 |
Hudson County | 608,975 | +4 | 634,266 | +12 | 708,100 | +6 | 747,400 |
New York | 18,976,457 | +2 | 19,378,102 | +4 | 20,146,131 | +2 | 20,604,030 |
Queens County | 2,229,379 | 0 | 2,230,722 | +9 | 2,436,549 | +5 | 2,565,268 |
New York County | 1,537,195 | +3 | 1,585,873 | +6 | 1,688,894 | +2 | 1,727,631 |
Bronx County | 1,332,650 | +4 | 1,385,108 | +10 | 1,519,809 | +6 | 1,604,168 |
Total Working Age Population:
Total Households:
Total Working Age Population:
Total Households:
Total Working Age Population:
Total Households: