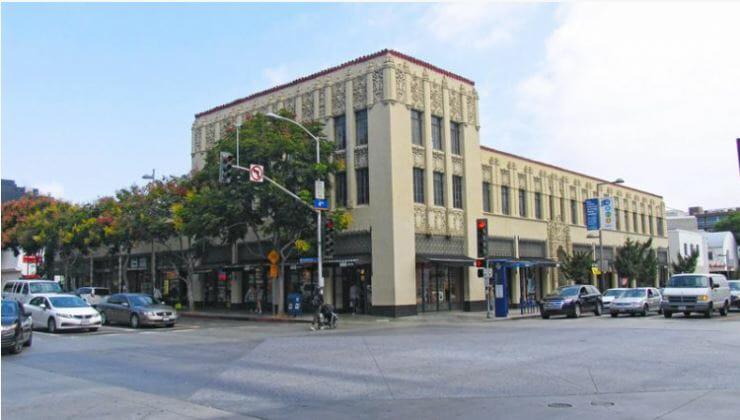
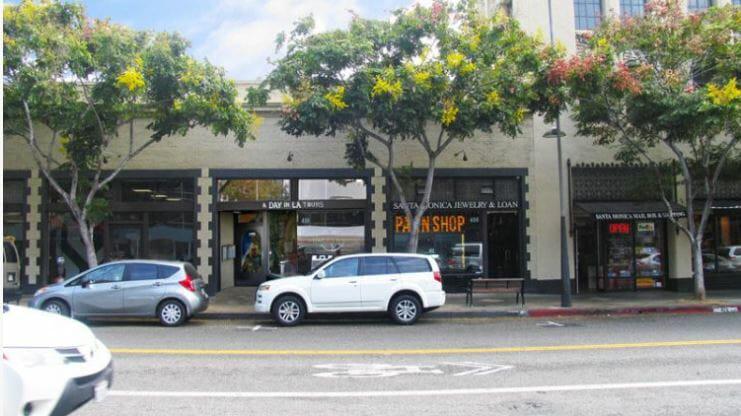
Retail Space
410 Broadway Santa Monica, CA 90401
410 Broadway Santa Monica, CA 90401
Details & Description
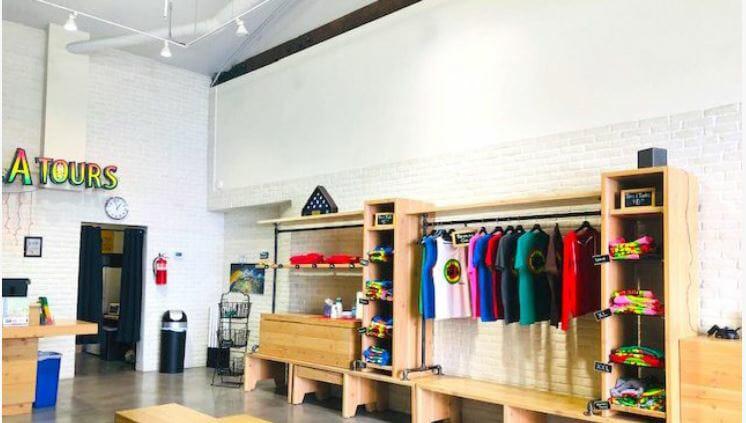
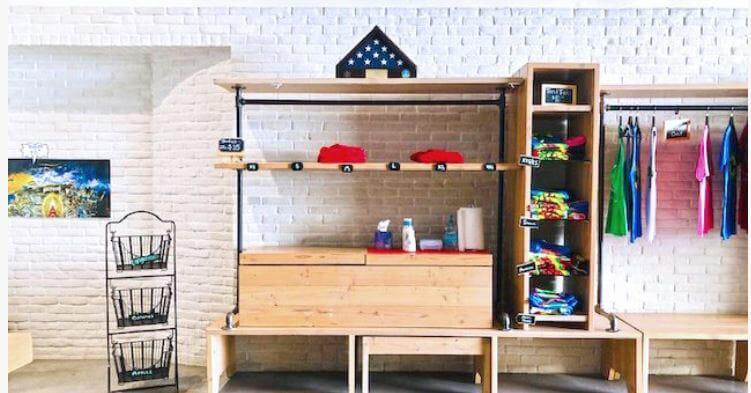
Additional Photos
Listing Agents

Brian James Bowen
O: 310-395-2663
brian@parcommercial.com
O: 310-395-2663
brian@parcommercial.com
While we strive to provide the most accurate information, all listing information, and demographic data, is provided by third-parties. As such, MyEListing will not be responsible for the accuracy of the information. It is strongly recommended that you verify all information with the listing agent, and any relevant agencies, prior to making any decisions.


