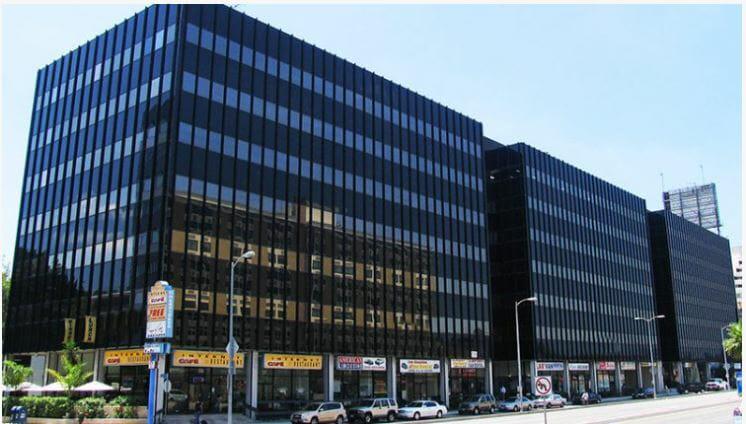
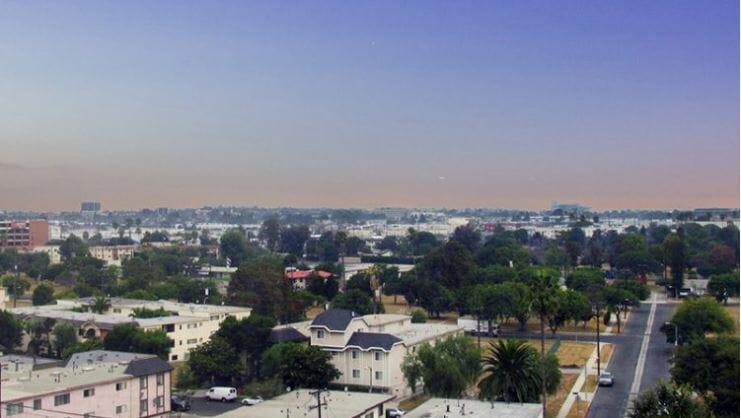
PROPERTY DESCRIPTIONLocated on Century Boulevard with plenty of parking. The south side of the building overlooks the airport runways of Los Angeles International Airport, the north side overlooks Century Boulevard. The building has on-site management, maintenance and engineer.Patrol personnel on duty 24 hours a day with after-hour access via card key. It is located less than a mile from LAX and 1 mile from San Diego (405) Freeway and Century (105) Freeway. It is surrounded by retail shops, convenient services, hotels. 4 cars per 1,000 square feet of covered subterranean parking, with valet services.PARKING: 4/1000Unreserved @ $100 per spaceTandem @ $150 per spaceTERM: 1-10 yearsTENANT IMPROVEMENTS: Negotiable• Scenic views of LAX runways• On site management• Suites available for immediate occupancy• Storage space available• Abundant/secure parkingSuite 201 500 Sq Ft $1.10 Per SFSuite 209 1,100 Sq Ft $1.10 Per SFSuite 211 1,122 Sq Ft $1.10 Per SFSuite 212 574 Sq Ft $1.10 Per SFSuite 301 (A) 655 Sq Ft $1.10 Per SFSuite 304 700 Sq Ft $1.10 Per SFSuite 305 1,909 Sq Ft $1.10 Per SFSuite 310 1,028 Sq Ft $1.10 Per SFSuite 312 600 Sq Ft $1.10 Per SFSuite 314 966 Sq Ft $1.10 Per SFSuite 407 706 Sq Ft $1.15 Per SFSuite 420 620 Sq Ft $1.15 Per SFSuite 422 596 Sq Ft $1.15 Per SFSuite 434 697 Sq Ft $1.15 Per SFSuite 441 1,803 Sq Ft $1.15 Per SFSuite 442 2,675 Sq Ft $1.15 Per SFSuite 500 3,054 Sq Ft $1.20 Per SFSuite 511 1,052 Sq Ft $1.20 Per SFSuite 540 1,480 Sq Ft $1.20 Per SFSuite 541 1,224 Sq Ft $1.20 Per SFSuite 632 1,320 Sq Ft $1.20 Per SFSuite 634 835 Sq Ft $1.20 Per SFSuite 702 11,300 Sq Ft $1.25 Per SF