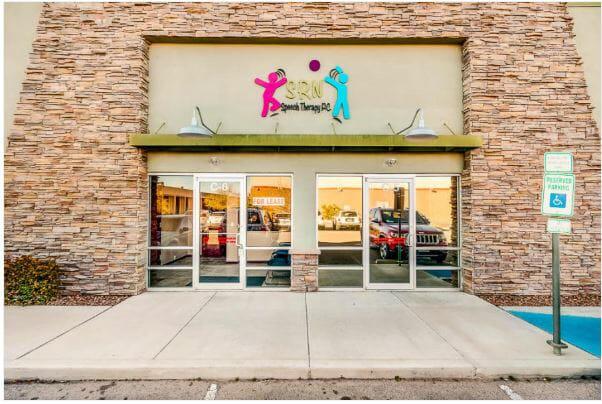
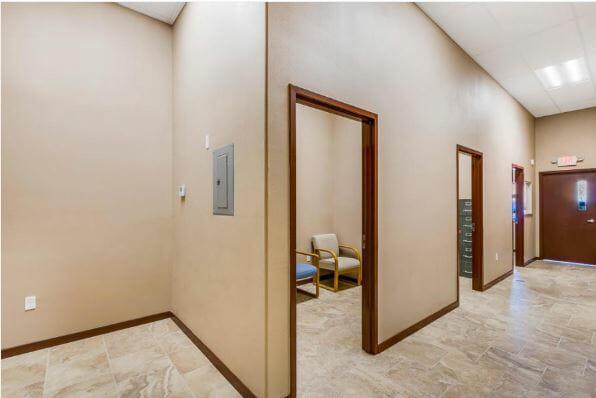
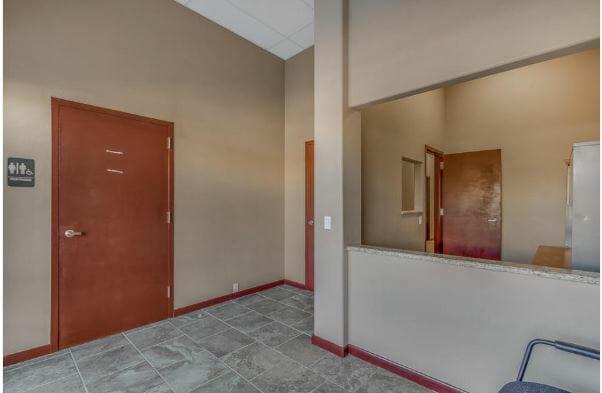
1-Mile | 3-Miles | 5-Miles | ||
---|---|---|---|---|
Total Population | 11,900 | 133,853 | 285,080 | |
Population Median Age | 36 | 37 | 36 | |
Population by Age | 0-9 Yrs | 1343 (11%) | 16138 (12%) | 37287 (13%) |
10-19 Yrs | 1988 (16%) | 20709 (15%) | 45891 (16%) | |
20-29 Yrs | 2335 (19%) | 23323 (17%) | 47304 (16%) | |
30-39 Yrs | 1281 (10%) | 14762 (11%) | 33443 (11%) | |
40-49 Yrs | 1513 (12%) | 16463 (12%) | 36245 (12%) | |
50-59 Yrs | 1359 (11%) | 17707 (13%) | 34653 (12%) | |
60-69 Yrs | 1274 (10%) | 12759 (9%) | 25296 (8%) | |
70+ Yrs | 806 (6%) | 11990 (8%) | 24962 (8%) | |
Median HH Income | $44,596 | $47,095 | $45,897 | |
Total Household Income | < 24K | 1065 (24%) | 11656 (26%) | 23857 (26%) |
25-49K | 1281 (29%) | 11696 (26%) | 25322 (27%) | |
50-74K | 774 (17%) | 9118 (20%) | 18178 (19%) | |
75-99K | 481 (10%) | 4777 (10%) | 9848 (10%) | |
100-199K | 682 (15%) | 6060 (13%) | 11993 (13%) | |
200K+ | 120 (2%) | 1146 (2%) | 1880 (2%) | |
Highest Education Level | No Diploma | 734 | 15123 | 36003 |
Diploma or GED | 1940 | 22543 | 46160 | |
Some College | 2118 | 21792 | 44377 | |
Assoc. Degree | 689 | 6735 | 13510 | |
Bachelors Degree | 1319 | 12962 | 25191 | |
Higher Degree | 714 | 5469 | 10601 | |
Total Housing Units | 4,635 | 47,526 | 98,141 | |
--Owner-Occupied | 2,305 | 27,624 | 57,975 | |
--Renter-Occupied | 2,098 | 16,830 | 33,103 | |
Owner-Occupied Values | < 100K | 296 | 7990 | 19628 |
100-199K | 1688 | 15904 | 31720 | |
200-299K | 180 | 2535 | 4809 | |
300-399K | 105 | 814 | 1156 | |
400-499K | 12 | 75 | 137 | |
500K+ | 24 | 305 | 526 | |
Total Working Age Population | 9,383 | 105,882 | 220,538 | |
In Work Force | 5,998 | 66,453 | 137,370 | |
Not In Work Force | 3,385 | 39,429 | 83,168 | |
Workforce Employed | 5,560 | 61,511 | 125,353 | |
Workforce Unemployed | 278 | 3,980 | 8,594 | |
Civlian Workforce | 5,838 | 65,491 | 133,948 | |
Military Workforce | 159 | 962 | 3,422 | |
Total Households | 4,403 | 44,453 | 91,078 | |
Family Households | 2,863 | 32,477 | 68,022 | |
Non-Family Households | 1,540 | 11,976 | 23,055 | |
Married Couple | 1,880 | 20,945 | 43,844 | |
Other Family | 984 | 11,533 | 24,179 | |
Married w/Child | 832 | 8,367 | 18,430 | |
Single Male w/Child | 38 | 855 | 2,001 | |
Single Female w/Child | 527 | 4,764 | 9,666 |
Population Change Last Two Decades - Plus Projection
2000 | % | 2010 | % | 2020 | % | 2030 | |
---|---|---|---|---|---|---|---|
Texas | 20,851,820 | +21 | 25,145,561 | +18 | 29,677,668 | +18 | 34,894,452 |
El Paso County | 679,622 | +18 | 800,647 | +9 | 876,120 | +7 | 936,697 |
Total Working Age Population:
Total Households:
Total Working Age Population:
Total Households:
Total Working Age Population:
Total Households: