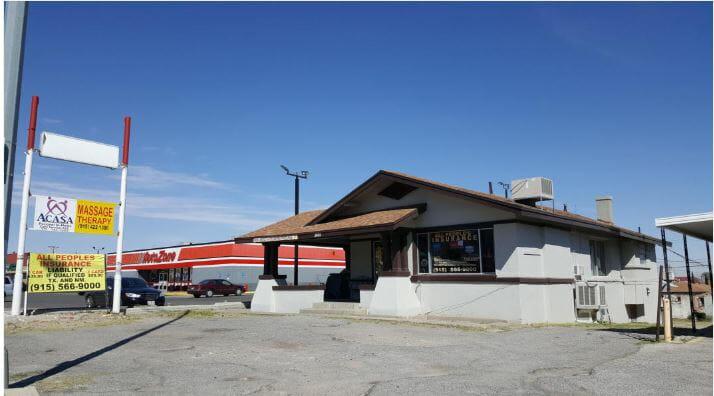
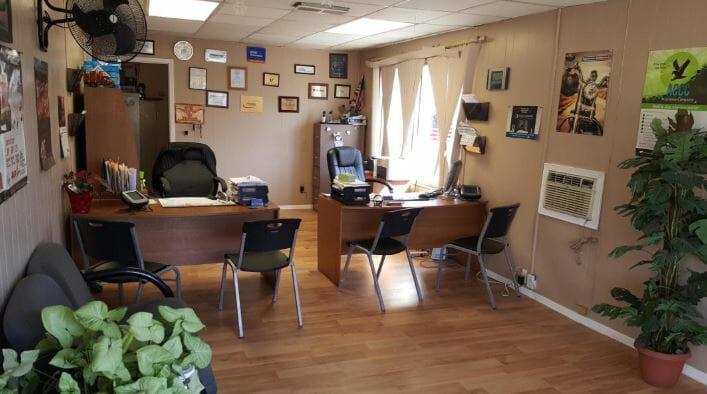
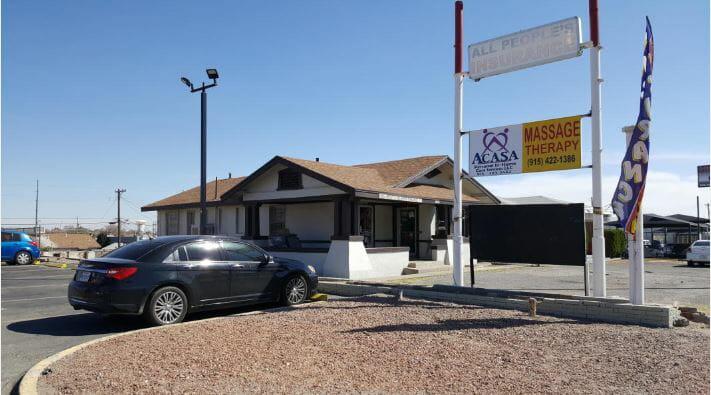
Good commercial location with frontage on busy Dyer Street, practically at the entrance to Fort Bliss. Daily traffic count over 11,000 according to RPR report. House converted into a mix-use property. Total of 4 units: 2 units rented for Office, $995 mo total + 2 apartments rented at $350 + $400 mo.=$20,940 yr GSI.Primary FeaturesCounty El PasoOff Market DateProperty Type CommercialSold DateSold PriceSubdivision Morningside HeightsZoning C3Financial DetailsApproximate Yearly Taxes 4148Exemptions NoneLease Info Assumable/AssignableLease Terms SaleLeaseable Area Y/N yesNumber Of Tenants 4Packages IncludesSale Includes Building and LandTax Year 2018Tenant Pays All UtilitiesAdditionalBest UseBar/Tavern/Lounge, Building Trade, Professional/Office, Restaurant, Retail, ShowroomEmpowerment Zone NoImproved YesMeasured By Appraiser CADProperty Building, Land (Fee Simple)Source Dimensions OtherVerification Actual RecordsExternal FeaturesConstruction StuccoDock NoFinance Considered Cash, ConventionalHandicap Access NoLot YesLot SqFt 8250Miscellaneous Exterior Sign Incl w/Sale, Sign OwnedNumber Of Parking SpacesParking 2+ Spaces per UnitProperty Access Paved Road to Prop, W Property LineUtilities All City, All Utilities, Natural GasInterior FeaturesCooling Evaporative Cooling, Refrigerated, Window Unit(s)Finished SpaceHeating Central, Forced Air, Natural GasRefrigerated YesLocation InformationFlood Zone NoLocation Freestanding, Highway Frontage