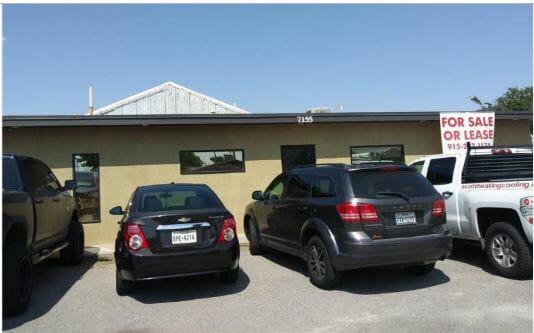
Property for sale or lease. Lease is $3500.00 a month. Screaming deal !Huge warehouse (10500 sq ft approximately) 1050 sq ft approximately of office space with conference room , kitchen , and male and female restrooms. state of the art surveillance security with various plasma tv security screens throughout. Basically just move in and everything is in place to do business. Ideal for Heating and cooling company , plumbing company or any type of construction business. With a warehouse this size any kind of distribution company would fit perfect .Primary FeaturesCounty El PasoOff Market DateProperty Type CommercialSold DateSold PriceSubdivisionZoning C4Financial DetailsApproximate Yearly Taxes 3104Exemptions UnknownLease InfoLease Terms 12 Months, SaleLeaseable Area Y/N yesNumber Of Tenants 4Packages Includes Building LeaseSale IncludesTax Year 2017Tenant Pays All UtilitiesAdditionalBest UseEmpowerment Zone YesImproved YesMeasured By Appraiser CADProperty BuildingSource Dimensions OtherVerification OtherExternal FeaturesConstructionDock YesFinance Considered Cash, ConventionalHandicap Access YesLotLot SqFt 12000Miscellaneous ExteriorNumber Of Parking SpacesParkingProperty Access Graded RoadUtilitiesInterior FeaturesCooling RefrigeratedFinished SpaceHeating Central, Forced AirRefrigeratedLocation InformationFlood Zone NoLocation Freestanding, Highway Frontage