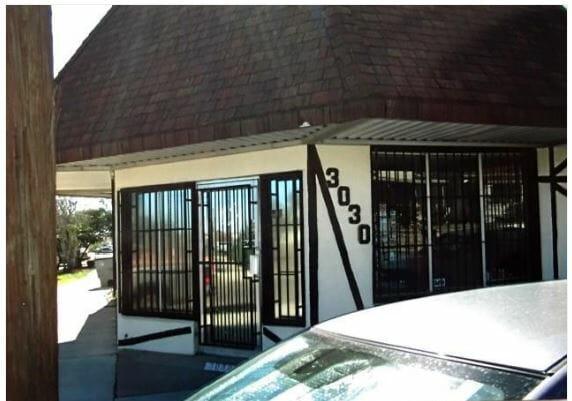
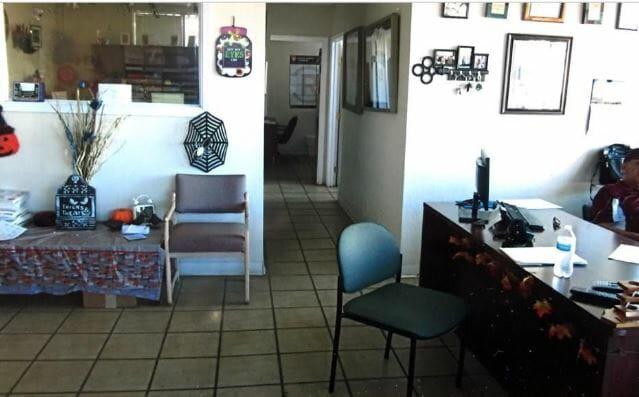
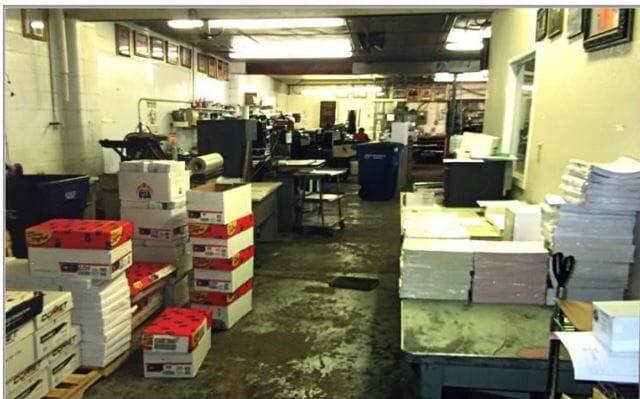
Nice Corner location Tularosa at N San Marcial St. near 5 points. Single story stand alone building. Currently Occupied by owner Print Shop. Investors: Owner will lease back from buyer at $2,500 a month for 2 Years. Tenant will pay utilities, repairs and maintain the HVAC units during the lease. Building is on CAD at 3,580 but there is a heated and cooled addition. Total building is 4500 sqft. Driveway into overhead door to enter the warehouse area. Owner finance potential with $125,000 down payment balance at 6% over 10 yrs.Primary FeaturesCounty El PasoOff Market DateProperty Type CommercialSold DateSold PriceSubdivisionZoning C4Financial DetailsApproximate Yearly Taxes 5103Exemptions NoneLease Info Call Listing Office, New Lease to BuyerLease Terms 24 Months, Lease BackLeaseable Area Y/N yesNumber Of Tenants 1Packages IncludesSale Includes Building and Land, LeaseTax Year 2018Tenant PaysElectricity, HVAC/MT, Internal Repairs, Janitor, LiabilityAdditionalBest UseDistribution, Industrial, Professional/Office, Retail, Showroom, WarehouseEmpowerment Zone NoImproved YesMeasured By OwnerProperty Building, Land (Fee Simple)Source Dimensions Owner ProvidedVerification OtherExternal FeaturesConstruction BlockDock NoFinance Considered Cash, ConventionalHandicap Access YesLotLot SqFt 5000Miscellaneous ExteriorNumber Of Parking SpacesParking On StreetProperty Access Paved Road to PropUtilities Call LOInterior FeaturesCooling 2+ Units, Evaporative Cooling, RefrigeratedFinished SpaceHeating 2+ Units, Central, ElectricRefrigerated YesLocation InformationFlood Zone NoLocation Corner Lot, Freestanding