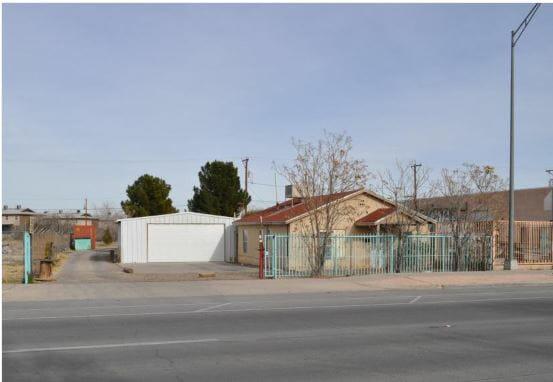
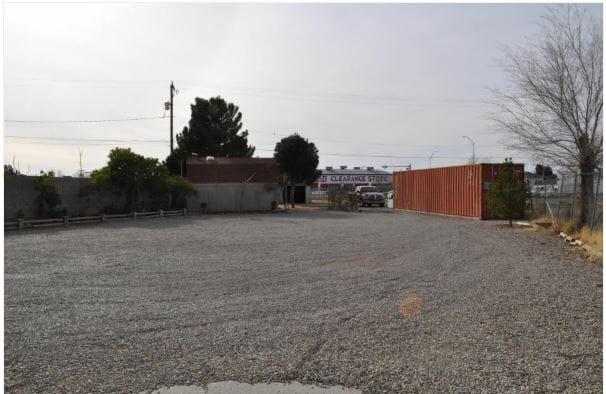
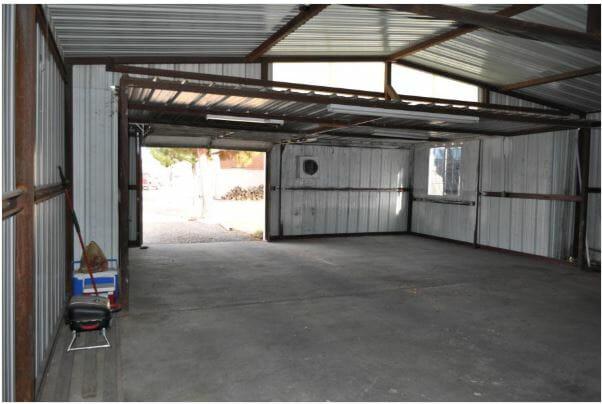
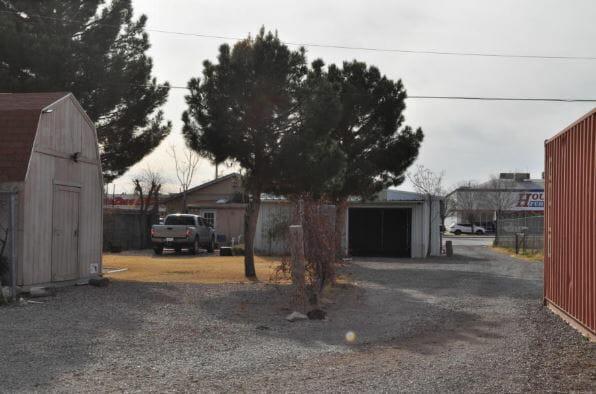
Great commercial property located on a busy main road. Land is about half an acre with five buildings. Big building on the rear that can have multiple uses, the house in front can be rented or used as residence or for offices. Big barn like storage building. Over sized garage adjacent to house with its own bathroom and next to it rv parking, already prepared with sewer and water connection. 9X40 Contrainer which can have several uses.Primary FeaturesCounty El PasoOff Market DateProperty Type CommercialSold DateSold PriceSubdivision North Loop GarZoning R3Financial DetailsApproximate Yearly TaxesExemptions HomesteadLease InfoLease Terms NoneLeaseable Area Y/NNumber Of Tenants 0Packages IncludesSale Includes Building and Land, Sale Only, See RemarksTax YearTenant PaysAdditionalBest UseEmpowerment Zone NoImproved YesMeasured By Appraiser CADProperty Building, Land (Fee Simple), See RemarksSource Dimensions Owner ProvidedVerification OtherExternal FeaturesConstruction Aluminum Siding, BlockDockFinance Considered Cash, Conventional, Owner May CarryHandicap Access YesLotLot SqFt 21736Miscellaneous Exterior Fenced, See Remarks, StorageNumber Of Parking SpacesParking See RemarksProperty Access Gravel Road, See RemarksUtilities All UtilitiesInterior FeaturesCooling Evaporative CoolingFinished SpaceHeating Natural GasRefrigeratedLocation InformationFlood Zone No