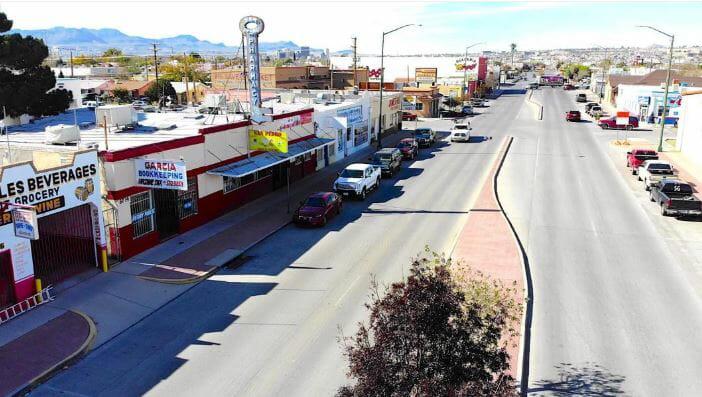
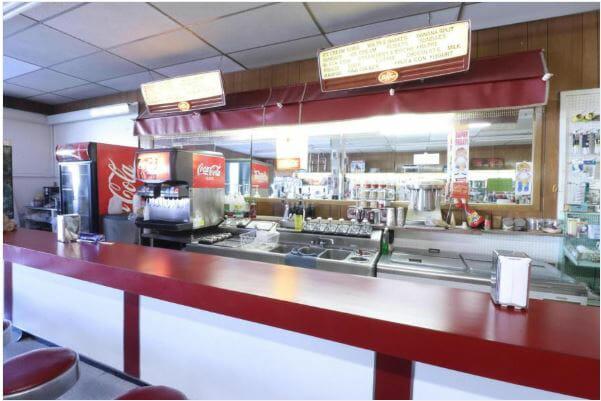
Commercial property located on Alameda Ave close to Copia St. Take advantage of this great investment opportunity and own 2660 sf of retail space with a 2660 sf basement, a approximately 2805 sf home that also includes an apartment studio and a storage area. Building is presently divided in to two suites. Owner operates a convenience store on one side and a beauty salon on the other. Eligible for City and State incentive as the property is located in the City's Empowerment Zone area. Easy access to international port of entry, I-10 and downtown El Paso. This multi-tenant property is a low-risk investment with a high potential net rental income. Property is also available for lease.Primary FeaturesCounty El PasoOff Market DateProperty Type CommercialSold DateSold PriceSubdivisionZoning C4Financial DetailsApproximate Yearly TaxesExemptions NoneLease Info Call Listing OfficeLease Terms NegotiableLeaseable Area Y/N yesNumber Of Tenants 0Packages Includes Contact LASale IncludesTax YearTenant Pays All UtilitiesAdditionalBest UseChild Care, Dental, Medical, Professional/Office, Restaurant, Retail, See Remarks, ShowroomEmpowerment Zone YesImproved YesMeasured By OwnerProperty Building, Other ImprovementsSource Dimensions OtherVerification OtherExternal FeaturesConstruction Brick, ConcreteDock NoFinance ConsideredCash, Conventional, Owner May Carry, See Remarks, Seller AssistedHandicap Access YesLot YesLot SqFt 3500Miscellaneous ExteriorNumber Of Parking SpacesParking On Street, See RemarksProperty Access Paved Road to PropUtilities All CityInterior FeaturesCooling 2+ Units, Central Air, Evaporative CoolingFinished Space yesHeating 2+ Units, Central, Floor FurnaceRefrigerated NoLocation InformationFlood Zone YesLocation See Remarks