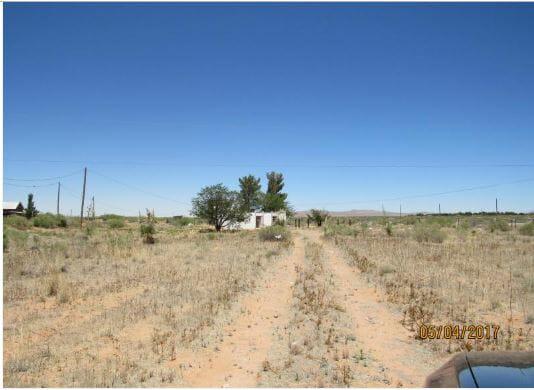
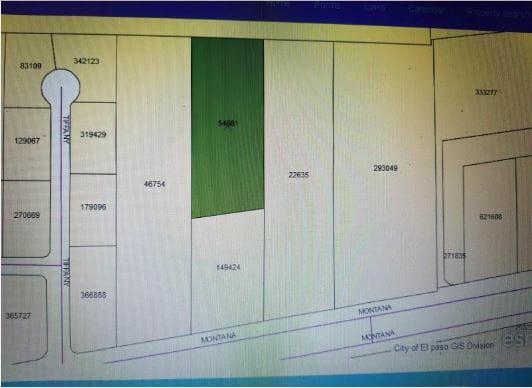
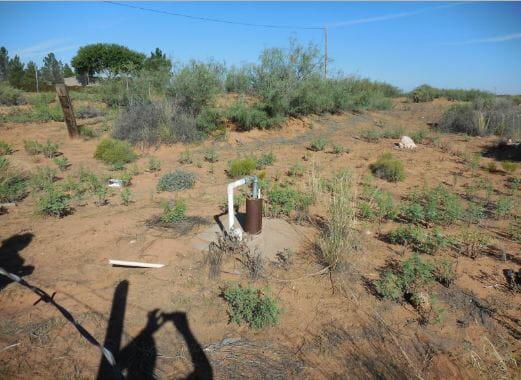
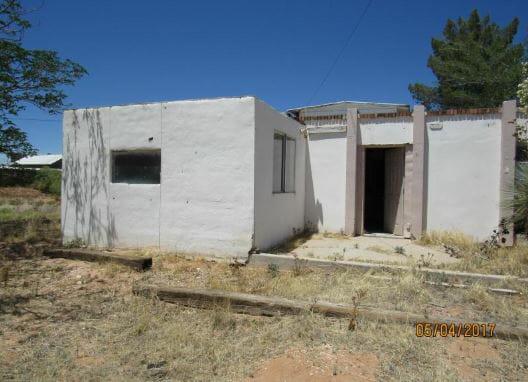
East Montana. 2.06 acres. 300 ft AWAY FROM Montana Ave. PROPERTY HAS NO FRONTAGE ON MONTANA. Value is on the land. Water, electric on the property. Septic System. SOLD AS IS. There is a 20-foot easement along 300 feet of the west fence to get to property from Montana Ave. Please see attached Survey and Easement documents. House is 1589 sq.ft and it is a fixer upper. It is not in livable condition and will not pass any inspection. Roof replaced in 2015, but otherwise house needs a full rehab. Would be great for business or industrial use. Property has a water well that could be put back into use. Well needs rehab too! Seller financing possible with 50K down payment.Primary FeaturesCounty El PasoOff Market DateProperty Type CommercialSold DateSold PriceSubdivision Mountain ViewZoning R1Financial DetailsApproximate Yearly Taxes 1794Exemptions None, Propane TankLease Info NoneLease Terms NoneLeaseable Area Y/NNumber Of Tenants 0Packages Includes See RemarksSale Includes Sale OnlyTax Year 2018Tenant PaysAdditionalBest Use See RemarksEmpowerment Zone NoImproved YesMeasured By Appraiser CADProperty Building, Land (Fee Simple), See RemarksSource Dimensions Owner ProvidedVerification Actual RecordsExternal FeaturesConstruction See RemarksDockFinance Considered Cash, Conventional, Seller AssistedHandicap Access NoLot YesLot SqFt 90431Miscellaneous Exterior See RemarksNumber Of Parking SpacesParking See RemarksProperty Access Unimproved RoadUtilitiesCable TV - Available, Electricity Available, LP/Propane, Phone AvailableInterior FeaturesCooling Evaporative CoolingFinished SpaceHeating Central, Forced AirRefrigerated NoLocation InformationFlood Zone NoLocation Rural