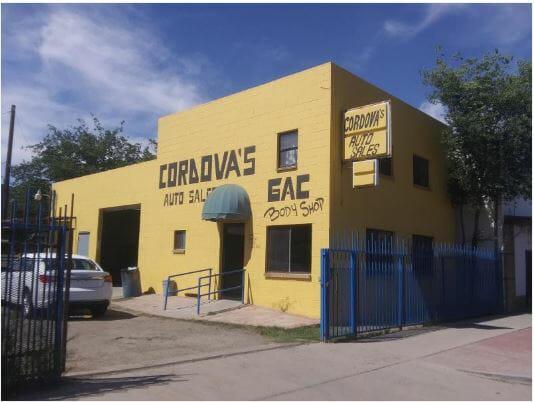
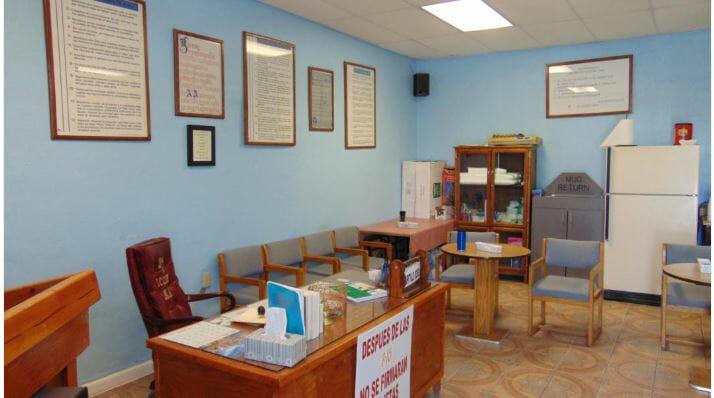
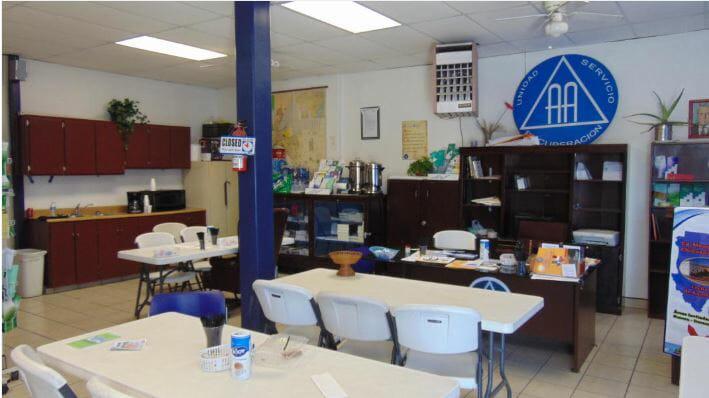
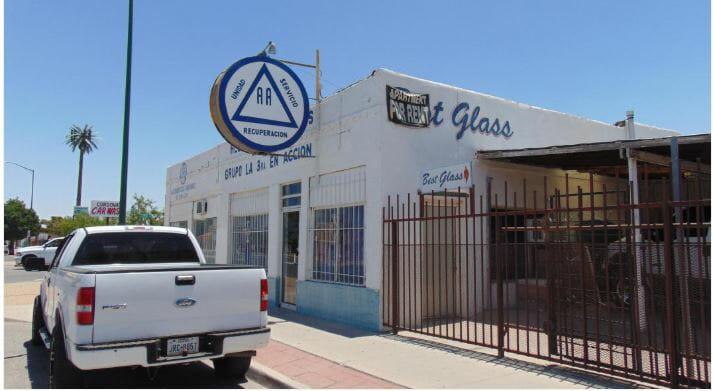
1-Mile | 3-Miles | 5-Miles | ||
---|---|---|---|---|
Total Population | 10,931 | 87,703 | 143,771 | |
Population Median Age | 39 | 40 | 38 | |
Population by Age | 0-9 Yrs | 1299 (11%) | 9709 (11%) | 18150 (12%) |
10-19 Yrs | 1756 (16%) | 11495 (13%) | 18683 (12%) | |
20-29 Yrs | 1528 (13%) | 13639 (15%) | 26547 (18%) | |
30-39 Yrs | 1309 (11%) | 10397 (11%) | 17644 (12%) | |
40-49 Yrs | 948 (8%) | 9366 (10%) | 14600 (10%) | |
50-59 Yrs | 1399 (12%) | 11479 (13%) | 17172 (11%) | |
60-69 Yrs | 1061 (9%) | 9167 (10%) | 13498 (9%) | |
70+ Yrs | 1631 (14%) | 12452 (14%) | 17476 (12%) | |
Median HH Income | $21,413 | $27,496 | $31,775 | |
Total Household Income | < 24K | 2253 (58%) | 14775 (46%) | 20846 (40%) |
25-49K | 1035 (27%) | 8953 (28%) | 14916 (29%) | |
50-74K | 318 (8%) | 3568 (11%) | 7219 (14%) | |
75-99K | 158 (4%) | 1843 (5%) | 3483 (6%) | |
100-199K | 62 (1%) | 2081 (6%) | 3695 (7%) | |
200K+ | 1 (0%) | 433 (1%) | 767 (1%) | |
Highest Education Level | No Diploma | 3486 | 21622 | 28658 |
Diploma or GED | 1594 | 13314 | 21329 | |
Some College | 1168 | 11279 | 19525 | |
Assoc. Degree | 284 | 3831 | 6318 | |
Bachelors Degree | 419 | 6249 | 11569 | |
Higher Degree | 84 | 3314 | 5879 | |
Total Housing Units | 4,636 | 36,686 | 58,846 | |
--Owner-Occupied | 1,467 | 14,234 | 21,366 | |
--Renter-Occupied | 2,361 | 17,419 | 29,560 | |
Owner-Occupied Values | < 100K | 1166 | 8599 | 11958 |
100-199K | 282 | 4377 | 7004 | |
200-299K | 2 | 643 | 1361 | |
300-399K | 0 | 377 | 606 | |
400-499K | 1 | 108 | 188 | |
500K+ | 16 | 130 | 250 | |
Total Working Age Population | 8,456 | 70,885 | 114,454 | |
In Work Force | 4,540 | 38,730 | 66,874 | |
Not In Work Force | 3,915 | 32,155 | 47,580 | |
Workforce Employed | 4,090 | 33,870 | 55,333 | |
Workforce Unemployed | 449 | 3,147 | 4,862 | |
Civlian Workforce | 4,539 | 37,017 | 60,195 | |
Military Workforce | 1 | 1,713 | 6,680 | |
Total Households | 3,828 | 31,653 | 50,927 | |
Family Households | 2,500 | 19,377 | 31,524 | |
Non-Family Households | 1,328 | 12,276 | 19,402 | |
Married Couple | 1,226 | 11,192 | 19,073 | |
Other Family | 1,274 | 8,185 | 12,451 | |
Married w/Child | 363 | 3,904 | 7,378 | |
Single Male w/Child | 109 | 618 | 852 | |
Single Female w/Child | 520 | 2,514 | 4,192 |
Population Change Last Two Decades - Plus Projection
2000 | % | 2010 | % | 2020 | % | 2030 | |
---|---|---|---|---|---|---|---|
Texas | 20,851,820 | +21 | 25,145,561 | +18 | 29,677,668 | +18 | 34,894,452 |
El Paso County | 679,622 | +18 | 800,647 | +9 | 876,120 | +7 | 936,697 |
New Mexico | 1,819,046 | +13 | 2,059,179 | +6 | 2,187,183 | +6 | 2,308,475 |
Doña Ana County | 174,682 | +20 | 209,233 | +11 | 232,946 | +9 | 255,070 |
Total Working Age Population:
Total Households:
Total Working Age Population:
Total Households:
Total Working Age Population:
Total Households: