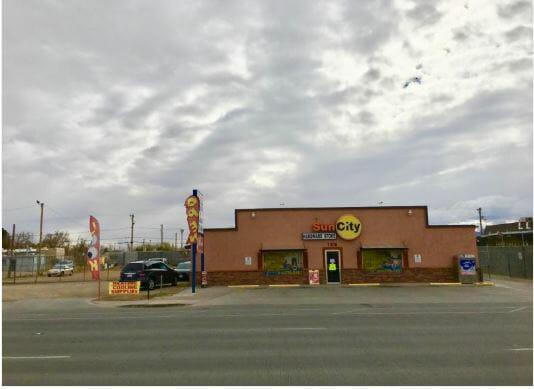
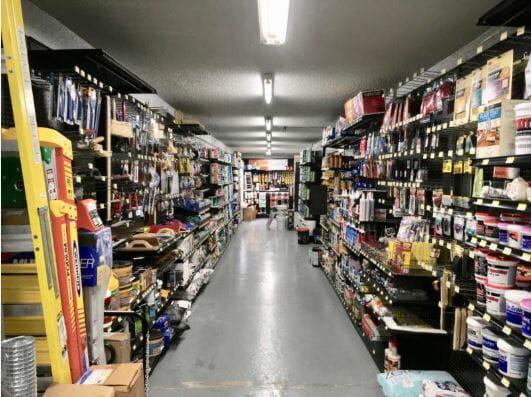
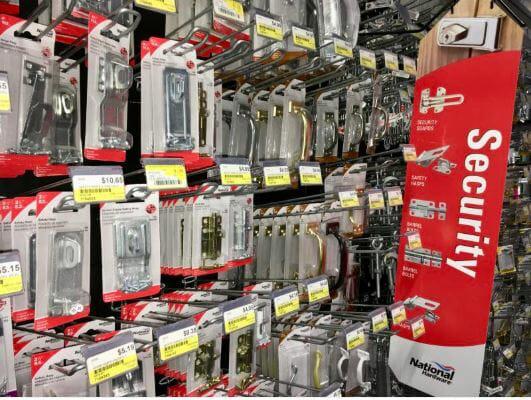
This Beautiful Hardware Store is an ideal turn-key business has been in business for over 30 years and makes a solid income with over 5000 customers in the neighborhood. The owners spent over $150,000 to upgrade to a franchise type Hardware Store, with all new shelving, equipment, floors, building expansion and redesign and all new inventory. The Business Only is For Sale for $495,000. It includes over $350,000 in Wholesale Inventory that the business owners will release at a major discount to equate $300,000. There are $68,016 in assets in the business. The Net income profit it produces per year is over $66,000 per year with 3 employees. The net income per year after all expenses multiplied by 3.3 years equals $217,984. So if you add $300,000 Inventory + $68,016 in Assets + $217,984 in net income over 3.3 years the total price for the business is $586,000. New Price of $495K. The company has finished their website and generates daily leads on the internet. Please check it out at www.SunCityHardwareStore.comPrimary FeaturesCounty El PasoOff Market DateProperty Type CommercialSold DateSold PriceSubdivision Stiles GardensZoning C3Financial DetailsApproximate Yearly TaxesExemptions NoneLease InfoAssumable/Assignable, New Lease to Buyer, Other ChargesLease Terms OtherLeaseable Area Y/N yesNumber Of Tenants 0Packages IncludesBalance Sheets, Building Lease, List of Equipment, Photos of Assets, Profit/Loss Statement, Tax Records, Traffic CountSale IncludesAssets, Equipment, Fixtures, Franchise, Furnishings, Inventory, Lease, License/Permits, Name, No Competition Clause, See RemarksTax YearTenant PaysAll Utilities, Electricity, Exterior Maintenance, Gas, Glass, Grounds Care, Heat, Liability, Sanitation, Security, See Remarks, Sewer, WaterAdditionalBest Use Retail, See RemarksEmpowerment Zone NoImproved YesMeasured By Appraiser CADProperty Building, Other ImprovementsSource Dimensions Owner ProvidedVerification OtherExternal FeaturesConstruction Adobe, Concrete, Glass, See RemarksDockFinance ConsideredCash, Contract, Conventional, Deed of Trust, Lease Option, Lease Purchase, Owner May Carry, RE Contract, Seller AssistedHandicap Access YesLot NoLot SqFt 16755Miscellaneous ExteriorDumpster Lease/Rented, Fenced, Security Lighting, See Remarks, Sign Incl w/Sale, Sign Owned, StorageNumber Of Parking SpacesParkingProperty Access See RemarksUtilitiesAll City, All Utilities, Cable TV - Available, Phone AvailableInterior FeaturesCooling 2+ Units, RefrigeratedFinished Space yesHeating 2+ Units, Forced Air, Natural GasRefrigerated YesLocation InformationFlood Zone NoLocation Freestanding