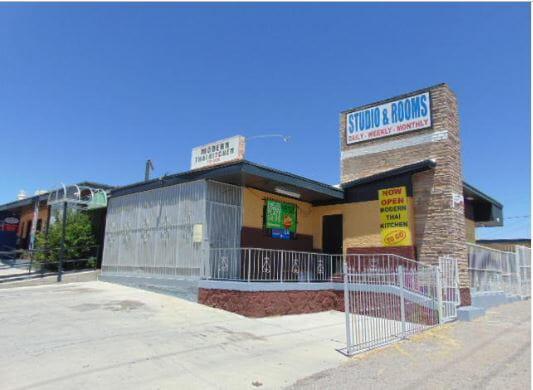
GREAT INCOME PROPERTY. This 24 room hotel is ready for a new owner. The business is in a very busy area with a lot of walk-in/ drive-in clients. Walking distance to WalMart on Dyer and Fred Wilson. Near many restaurants to include; Burger King, Subway, McDonalds, to name a few. It is only minutes away from Fort Bliss, US54, SPUR601. It has long term tenants in several of the rooms, rented monthly and generating consistent monthly income. Currently being used as a hotel but can be converted to other businesses due to C4 zoning. It comes with a kitchen for take out food which is a second source of income for the current owner. Make it yours today and call the listing agent for more information. All inventory with the purchase of the business included; 16 security cameras and equipment, laundry room equipment, kitchen equipment, beds, etc.Primary FeaturesCounty El PasoOff Market DateProperty Type CommercialSold DateSold PriceSubdivision Logan HeightsZoning C4Financial DetailsApproximate Yearly Taxes 5420Exemptions UnknownLease InfoLease Terms NoneLeaseable Area Y/NNumber Of Tenants 24Packages IncludesAccounts Payable, Accounts Receivable, Contact LA, Insurance PoliciesSale IncludesAssets, Building and Land, Equipment, Fixtures, Franchise, Furnishings, Inventory, Lease, Liabilities, License/PermitsTax Year 2019Tenant Pays NoneAdditionalBest UseHotel/Motel, Restaurant, Retail, See Remarks, Shopping CenterEmpowerment Zone YesImproved YesMeasured By Appraiser CADProperty BuildingSource Dimensions Owner ProvidedVerification ProjectionExternal FeaturesConstructionDockFinance Considered Cash, Conventional, TX VeteranHandicap Access YesLot YesLot SqFt 13994Miscellaneous ExteriorNumber Of Parking Spaces 28Parking 1 Space Per UnitProperty AccessUtilities All CityInterior FeaturesCooling RefrigeratedFinished SpaceHeating Central, Forced AirRefrigerated YesLocation InformationFlood Zone NoLocation Corner Lot