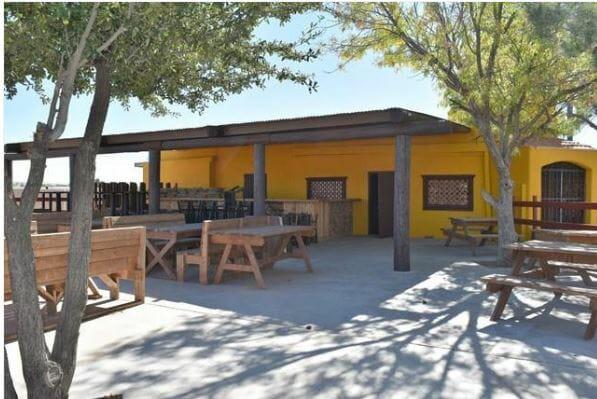
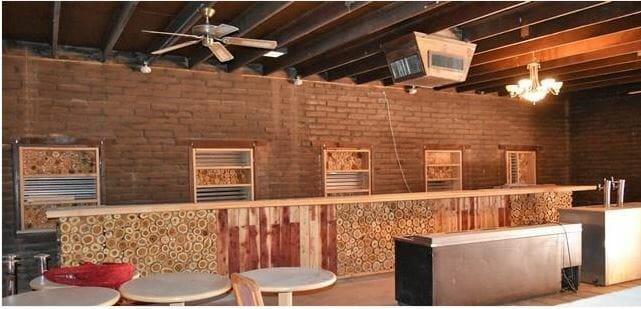
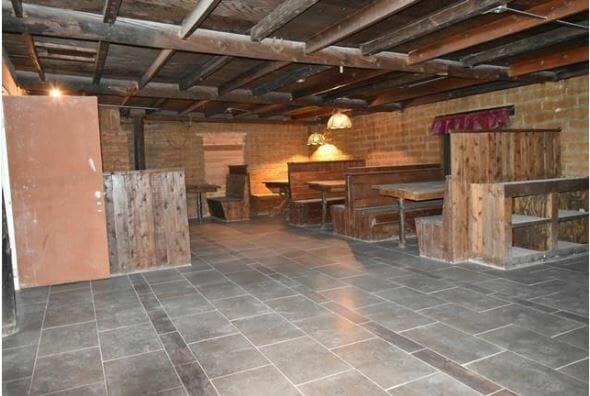
PLEASE DO NOT DISTURB THE TENANTS. Great property for sale on the rapidly expanding part of town on Montana Avenue. Property includes previous famous restaurant building of 5,961 approximate square feet . Plus barn and corrals. 3 Concrete slab for additional buildings. 3 Septic tanks. Non used Well plus city water and electric. Large and tall light signage. 196 foot frontage on Montana. Includes 3.24 Acres of Land. Building has multiple rooms, bathrooms, bars, office and concrete patio. Great location for Restaurant facilities, Business facilities, Warehouse operation or trucking business. Under triple net lease . Possible owner financing with 30% down 8% interest 7 years balloon.Primary FeaturesCounty El PasoOff Market DateProperty Type CommercialSold DateSold PriceSubdivisionZoning C3Financial DetailsApproximate Yearly TaxesExemptions NoneLease Info NNNLease Terms SaleLeaseable Area Y/N yesNumber Of Tenants 1Packages Includes Contact LASale Includes Fixtures, Lease, Sale OnlyTax YearTenant Pays All UtilitiesAdditionalBest UseBar/Tavern/Lounge, Professional/Office, Restaurant, Showroom, WarehouseEmpowerment Zone NoImproved YesMeasured By Appraiser CADProperty BuildingSource Dimensions OtherVerification OtherExternal FeaturesConstruction Adobe, MasonryDockFinance ConsideredCash, Conventional, See Remarks, Seller AssistedHandicap Access YesLotLot SqFt 3Miscellaneous ExteriorNumber Of Parking SpacesParkingProperty AccessUtilities Electricity Available, Some City, Underground UtilitiesInterior FeaturesCooling RefrigeratedFinished SpaceHeating ElectricRefrigerated YesLocation InformationFlood Zone NoLocation Highway Frontage, Interstate Frontage