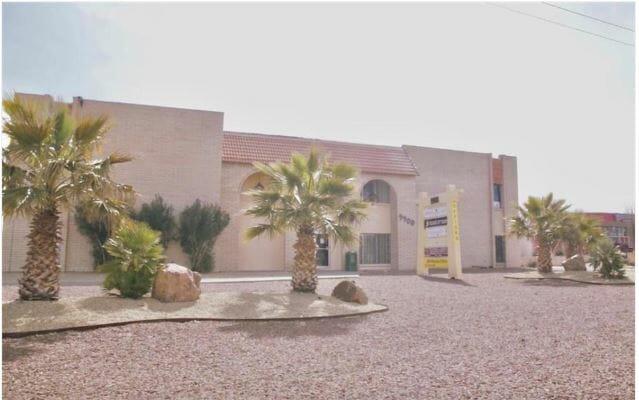
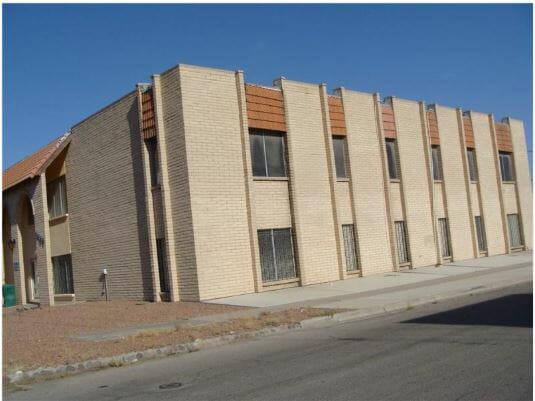
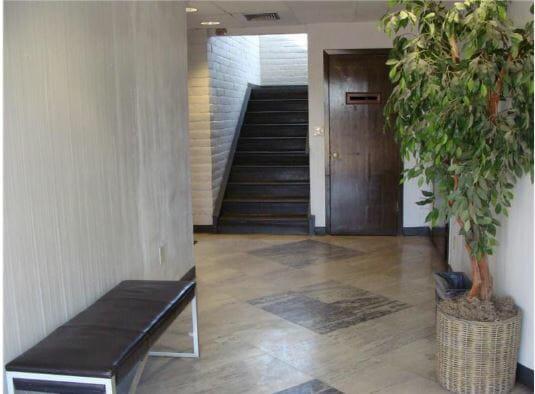
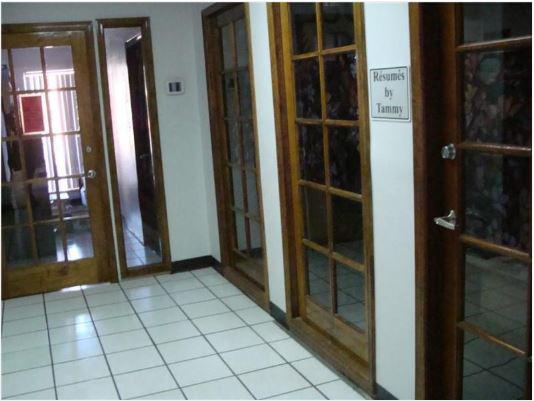
Great Eastwood location! Office building in East Side off Montana , for sale, Partially leased( 8 tenants) offices available on the first floor approx 2,000sq ft. available for lease can divide, utilities included in leases. there are 4 bathrms upstairs and 4 bathrooms downstairs, Computerized Security system, Cameras and Electronic locks, Waiting areas,Storage, lots of parking. FYI: aprox. 2,100 ft vacant office space leasing for $2100 utilities included and 1 small office $200 all on first floor.Primary FeaturesCounty El PasoOff Market DateProperty Type CommercialSold DateSold PriceSubdivision ScotsdaleZoning C4Financial DetailsApproximate Yearly TaxesExemptions NoneLease Info Assumable/AssignableLease Terms SaleLeaseable Area Y/N yesNumber Of Tenants 9Packages Includes Insurance PoliciesSale Includes Building and Land, Sale OnlyTax YearTenant Pays LiabilityAdditionalBest UseDental, Medical, Professional/Office, Showroom, WarehouseEmpowerment Zone NoImproved YesMeasured By Appraiser CADProperty BuildingSource Dimensions OtherVerification OtherExternal FeaturesConstruction Brick VeneerDockFinance Considered Cash, ConventionalHandicap Access NoLot YesLot SqFt 26250Miscellaneous ExteriorDumpster Lease/Rented, Security LightingNumber Of Parking Spaces 34Parking UnassignedProperty Access Paved Road to PropUtilities All CityInterior FeaturesCooling RefrigeratedFinished Space yesHeating Central, Forced AirRefrigerated YesLocation InformationFlood Zone NoLocation Corner Lot