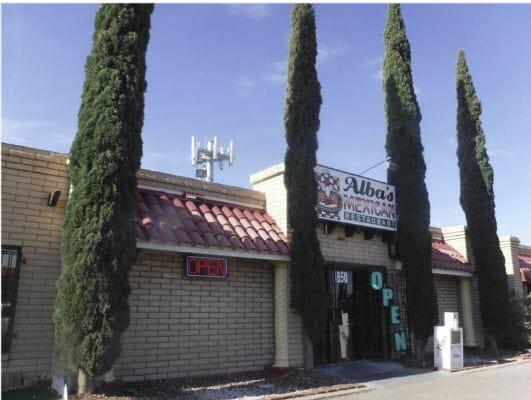
Property Description:NOTE: Full Address is 1848-1858 Trawood. DREAM BIG. Thriving retail center with long-term loyal tenants on short renewable leases. Tenants are Mrs. Baker's Dance Studio; Agave Pet Grooming; Alba's Mexican Restaurant; Southwest Wellness; 2 billboards leased by Clear Channel. Sale includes adjacent +/-.83 ac vacant lot with frontage on both Trawood and Cuatro Vistas. What an opportunity for the ambitious entrepreneur to exploit its growth potential! Subject is at corner of Trawood at Mosswood, just minutes from I-10 & between Yarbrough & Lomaland. Plenty of parking around subject, w/overflow space in paved area of adjoining lot.. Offices & other retail centers next to near subject, as well as the park on Mosswood, drive traffic into the area, contributing to great business synergy. AGENTS: Access to the units only during business hours. Please ask tenants' permission to show. Thank you for your courtesy. .Vacant end unit on Sentri LB. See MLS #805904Primary FeaturesCounty: El PasoOff Market Date:Property Type: CommercialSold Date:Sold Price:Subdivision: Eastwood HghtsZoning: C1Financial DetailsApproximate Yearly Taxes:Exemptions: NoneLease Info:Lease Terms: 24 Months, SaleLeaseable Area Y/N: yesNumber Of Tenants: 5Packages Includes:Sale Includes: NameTax Year:Tenant Pays:AdditionalBest Use: Restaurant, Retail, See Remarks, Shopping CenterEmpowerment Zone: NoImproved: YesMeasured By: Appraiser CADProperty: Building, Land (Fee Simple)Source Dimensions: OtherVerification: OtherExternal FeaturesConstruction: Slump BlockDock:Finance Considered: Owner Will CarryHandicap Access: NoLot: YesLot SqFt: 73527Miscellaneous Exterior: Dumpster Lease/Rented, Sign LeasedNumber Of Parking Spaces:Parking: UnassignedProperty Access: Paved Road to PropUtilities: All City, Electricity Available, Natural GasInterior FeaturesCooling: Evaporative Cooling, See RemarksFinished Space: yesHeating: Central, Forced Air, Natural GasRefrigerated: YesLocation InformationFlood Zone: NoLocation: Business Center, Corner Lot, Freestanding, Shopping Center