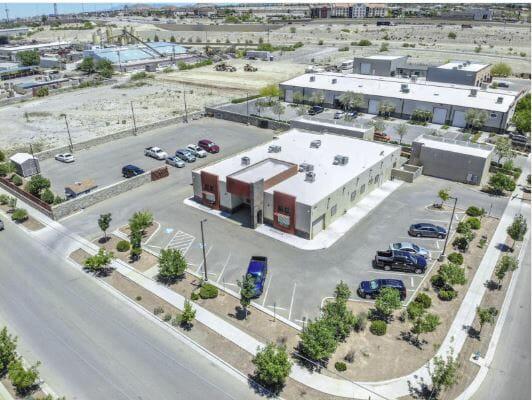
1-Mile | 3-Miles | 5-Miles | ||
---|---|---|---|---|
Total Population | 8,697 | 83,431 | 138,372 | |
Population Median Age | 38 | 36 | 35 | |
Population by Age | 0-9 Yrs | 912 (10%) | 12358 (14%) | 21479 (15%) |
10-19 Yrs | 1179 (13%) | 12408 (14%) | 20284 (14%) | |
20-29 Yrs | 1826 (20%) | 12560 (15%) | 20712 (14%) | |
30-39 Yrs | 850 (9%) | 10309 (12%) | 18205 (13%) | |
40-49 Yrs | 1121 (12%) | 10170 (12%) | 17794 (12%) | |
50-59 Yrs | 998 (11%) | 10533 (12%) | 16944 (12%) | |
60-69 Yrs | 825 (9%) | 7576 (9%) | 12138 (8%) | |
70+ Yrs | 985 (11%) | 7516 (9%) | 10816 (7%) | |
Median HH Income | $49,341 | $52,062 | $58,322 | |
Total Household Income | < 24K | 782 (26%) | 7278 (25%) | 10888 (23%) |
25-49K | 722 (24%) | 6260 (22%) | 9564 (20%) | |
50-74K | 660 (22%) | 4976 (17%) | 7780 (16%) | |
75-99K | 231 (7%) | 3199 (11%) | 5318 (11%) | |
100-199K | 444 (15%) | 4926 (17%) | 10341 (22%) | |
200K+ | 115 (3%) | 1449 (5%) | 3003 (6%) | |
Highest Education Level | No Diploma | 1082 | 8562 | 11764 |
Diploma or GED | 1055 | 9785 | 14441 | |
Some College | 1109 | 10243 | 17710 | |
Assoc. Degree | 333 | 3636 | 6022 | |
Bachelors Degree | 1431 | 12417 | 22088 | |
Higher Degree | 656 | 7408 | 14044 | |
Total Housing Units | 3,256 | 30,911 | 52,258 | |
--Owner-Occupied | 1,485 | 16,010 | 27,985 | |
--Renter-Occupied | 1,469 | 12,078 | 18,908 | |
Owner-Occupied Values | < 100K | 204 | 2611 | 3775 |
100-199K | 824 | 8452 | 12777 | |
200-299K | 186 | 2817 | 6749 | |
300-399K | 129 | 1235 | 2741 | |
400-499K | 37 | 245 | 933 | |
500K+ | 104 | 650 | 1011 | |
Total Working Age Population | 7,154 | 63,744 | 105,090 | |
In Work Force | 4,211 | 40,324 | 68,209 | |
Not In Work Force | 2,943 | 23,420 | 36,881 | |
Workforce Employed | 3,867 | 37,450 | 63,280 | |
Workforce Unemployed | 268 | 2,541 | 3,899 | |
Civlian Workforce | 4,135 | 39,991 | 67,179 | |
Military Workforce | 76 | 333 | 1,030 | |
Total Households | 2,954 | 28,088 | 46,894 | |
Family Households | 1,944 | 20,019 | 32,869 | |
Non-Family Households | 1,010 | 8,069 | 14,025 | |
Married Couple | 1,178 | 13,789 | 23,920 | |
Other Family | 765 | 6,230 | 8,949 | |
Married w/Child | 358 | 5,769 | 10,830 | |
Single Male w/Child | 33 | 610 | 863 | |
Single Female w/Child | 276 | 2,405 | 3,639 |
Population Change Last Two Decades - Plus Projection
2000 | % | 2010 | % | 2020 | % | 2030 | |
---|---|---|---|---|---|---|---|
Texas | 20,851,820 | +21 | 25,145,561 | +18 | 29,677,668 | +18 | 34,894,452 |
El Paso County | 679,622 | +18 | 800,647 | +9 | 876,120 | +7 | 936,697 |
New Mexico | 1,819,046 | +13 | 2,059,179 | +6 | 2,187,183 | +6 | 2,308,475 |
Doña Ana County | 174,682 | +20 | 209,233 | +11 | 232,946 | +9 | 255,070 |
Total Working Age Population:
Total Households:
Total Working Age Population:
Total Households:
Total Working Age Population:
Total Households: