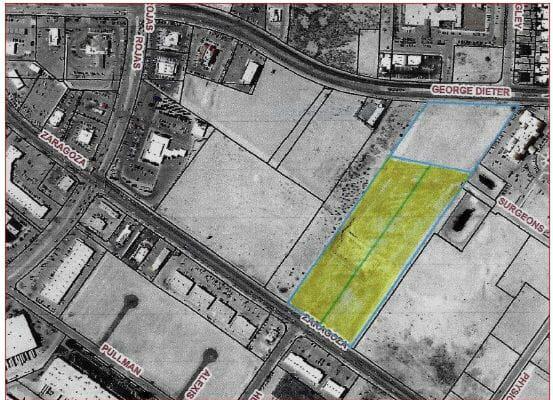
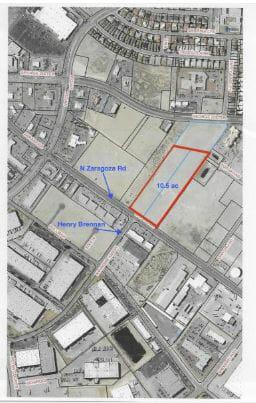
1-Mile | 3-Miles | 5-Miles | ||
---|---|---|---|---|
Total Population | 10,821 | 106,772 | 280,047 | |
Population Median Age | 34 | 36 | 36 | |
Population by Age | 0-9 Yrs | 1494 (13%) | 12406 (11%) | 36969 (13%) |
10-19 Yrs | 1923 (17%) | 17654 (16%) | 45775 (16%) | |
20-29 Yrs | 1806 (16%) | 19007 (17%) | 46450 (16%) | |
30-39 Yrs | 1171 (10%) | 11869 (11%) | 33081 (11%) | |
40-49 Yrs | 1573 (14%) | 13111 (12%) | 35897 (12%) | |
50-59 Yrs | 1185 (10%) | 13867 (12%) | 33785 (12%) | |
60-69 Yrs | 943 (8%) | 10349 (9%) | 24494 (8%) | |
70+ Yrs | 726 (6%) | 8508 (7%) | 23595 (8%) | |
Median HH Income | $53,928 | $46,430 | $45,630 | |
Total Household Income | < 24K | 554 (16%) | 8891 (25%) | 23144 (26%) |
25-49K | 1071 (31%) | 9409 (27%) | 24854 (28%) | |
50-74K | 637 (18%) | 7208 (20%) | 17563 (19%) | |
75-99K | 450 (13%) | 3737 (10%) | 9593 (10%) | |
100-199K | 716 (20%) | 4545 (13%) | 11405 (12%) | |
200K+ | 17 (0%) | 893 (2%) | 1732 (1%) | |
Highest Education Level | No Diploma | 707 | 12691 | 36492 |
Diploma or GED | 1809 | 18158 | 45542 | |
Some College | 1709 | 16767 | 42572 | |
Assoc. Degree | 670 | 4989 | 13560 | |
Bachelors Degree | 1084 | 9897 | 23860 | |
Higher Degree | 429 | 3964 | 9848 | |
Total Housing Units | 3,715 | 36,968 | 94,741 | |
--Owner-Occupied | 2,127 | 21,599 | 57,093 | |
--Renter-Occupied | 1,320 | 13,083 | 31,200 | |
Owner-Occupied Values | < 100K | 380 | 6923 | 20000 |
100-199K | 1547 | 11790 | 30988 | |
200-299K | 147 | 1853 | 4373 | |
300-399K | 24 | 686 | 1119 | |
400-499K | 0 | 70 | 138 | |
500K+ | 28 | 276 | 475 | |
Total Working Age Population | 8,073 | 84,219 | 215,807 | |
In Work Force | 5,556 | 53,007 | 134,382 | |
Not In Work Force | 2,517 | 31,212 | 81,425 | |
Workforce Employed | 5,236 | 49,188 | 123,085 | |
Workforce Unemployed | 255 | 3,141 | 8,434 | |
Civlian Workforce | 5,491 | 52,329 | 131,519 | |
Military Workforce | 65 | 678 | 2,863 | |
Total Households | 3,446 | 34,682 | 88,292 | |
Family Households | 2,586 | 25,380 | 66,546 | |
Non-Family Households | 861 | 9,302 | 21,747 | |
Married Couple | 1,917 | 16,340 | 42,917 | |
Other Family | 668 | 9,040 | 23,629 | |
Married w/Child | 902 | 6,474 | 18,163 | |
Single Male w/Child | 60 | 722 | 2,075 | |
Single Female w/Child | 368 | 3,755 | 9,495 |
Population Change Last Two Decades - Plus Projection
2000 | % | 2010 | % | 2020 | % | 2030 | |
---|---|---|---|---|---|---|---|
Texas | 20,851,820 | +21 | 25,145,561 | +18 | 29,677,668 | +18 | 34,894,452 |
El Paso County | 679,622 | +18 | 800,647 | +9 | 876,120 | +7 | 936,697 |
Total Working Age Population:
Total Households:
Total Working Age Population:
Total Households:
Total Working Age Population:
Total Households: