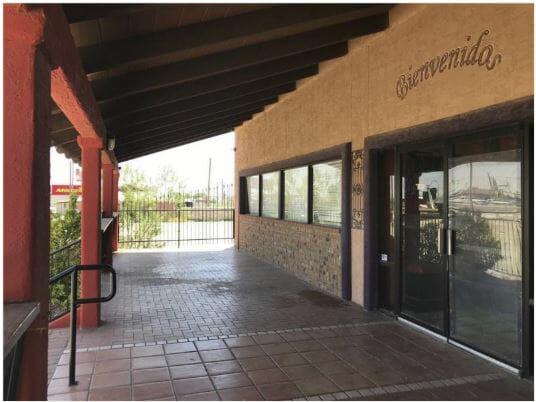
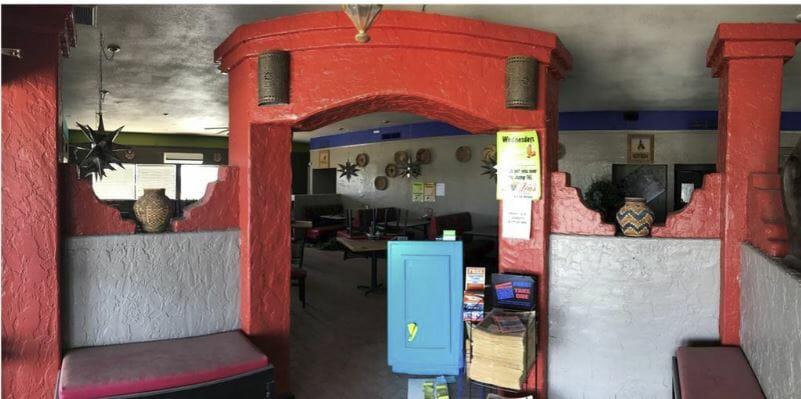
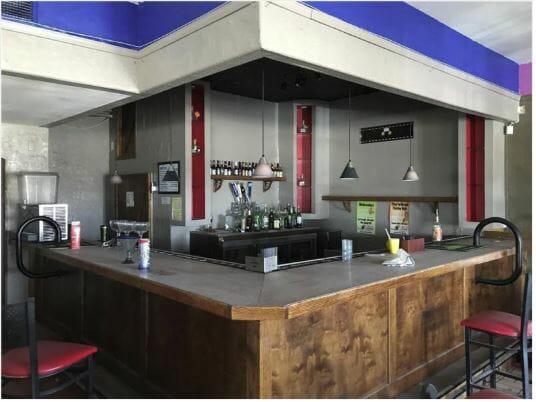
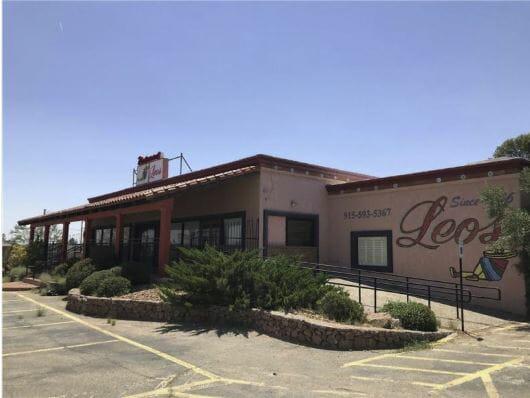
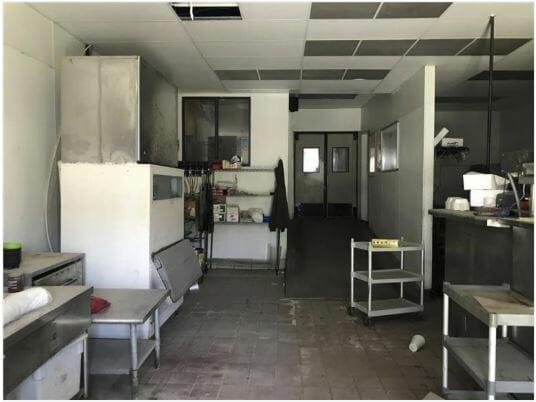
1-Mile | 3-Miles | 5-Miles | ||
---|---|---|---|---|
Total Population | 9,835 | 73,953 | 208,504 | |
Population Median Age | 38 | 38 | 37 | |
Population by Age | 0-9 Yrs | 1172 (11%) | 9667 (13%) | 26306 (12%) |
10-19 Yrs | 1457 (14%) | 9456 (12%) | 30189 (14%) | |
20-29 Yrs | 1383 (14%) | 12228 (16%) | 35959 (17%) | |
30-39 Yrs | 895 (9%) | 8291 (11%) | 23924 (11%) | |
40-49 Yrs | 1665 (16%) | 9596 (12%) | 24147 (11%) | |
50-59 Yrs | 1432 (14%) | 9555 (12%) | 25792 (12%) | |
60-69 Yrs | 792 (8%) | 6487 (8%) | 19227 (9%) | |
70+ Yrs | 1040 (10%) | 8671 (11%) | 22959 (11%) | |
Median HH Income | $55,592 | $47,044 | $42,164 | |
Total Household Income | < 24K | 822 (23%) | 6277 (24%) | 20252 (29%) |
25-49K | 773 (21%) | 7630 (29%) | 20249 (29%) | |
50-74K | 599 (17%) | 5357 (20%) | 13036 (18%) | |
75-99K | 473 (13%) | 2924 (11%) | 6885 (9%) | |
100-199K | 752 (21%) | 3277 (12%) | 7657 (11%) | |
200K+ | 100 (2%) | 553 (2%) | 1185 (1%) | |
Highest Education Level | No Diploma | 660 | 7500 | 28418 |
Diploma or GED | 1592 | 12216 | 34271 | |
Some College | 2008 | 13311 | 33342 | |
Assoc. Degree | 416 | 3942 | 9793 | |
Bachelors Degree | 1006 | 7410 | 17753 | |
Higher Degree | 636 | 3686 | 8193 | |
Total Housing Units | 3,987 | 28,387 | 75,417 | |
--Owner-Occupied | 2,258 | 14,861 | 40,456 | |
--Renter-Occupied | 1,261 | 11,158 | 28,808 | |
Owner-Occupied Values | < 100K | 331 | 3535 | 15383 |
100-199K | 1527 | 9499 | 21329 | |
200-299K | 315 | 1530 | 2702 | |
300-399K | 41 | 153 | 690 | |
400-499K | 0 | 10 | 54 | |
500K+ | 43 | 133 | 299 | |
Total Working Age Population | 7,802 | 58,640 | 164,473 | |
In Work Force | 5,094 | 36,863 | 100,082 | |
Not In Work Force | 2,708 | 21,777 | 64,390 | |
Workforce Employed | 4,601 | 32,183 | 84,628 | |
Workforce Unemployed | 360 | 2,277 | 6,618 | |
Civlian Workforce | 4,961 | 34,461 | 91,246 | |
Military Workforce | 133 | 2,402 | 8,836 | |
Total Households | 3,519 | 26,019 | 69,264 | |
Family Households | 2,344 | 17,844 | 48,743 | |
Non-Family Households | 1,175 | 8,175 | 20,521 | |
Married Couple | 1,494 | 11,519 | 30,687 | |
Other Family | 851 | 6,324 | 18,056 | |
Married w/Child | 622 | 4,684 | 12,465 | |
Single Male w/Child | 50 | 418 | 1,426 | |
Single Female w/Child | 271 | 2,145 | 6,413 |
Population Change Last Two Decades - Plus Projection
2000 | % | 2010 | % | 2020 | % | 2030 | |
---|---|---|---|---|---|---|---|
Texas | 20,851,820 | +21 | 25,145,561 | +18 | 29,677,668 | +18 | 34,894,452 |
El Paso County | 679,622 | +18 | 800,647 | +9 | 876,120 | +7 | 936,697 |
Total Working Age Population:
Total Households:
Total Working Age Population:
Total Households:
Total Working Age Population:
Total Households: