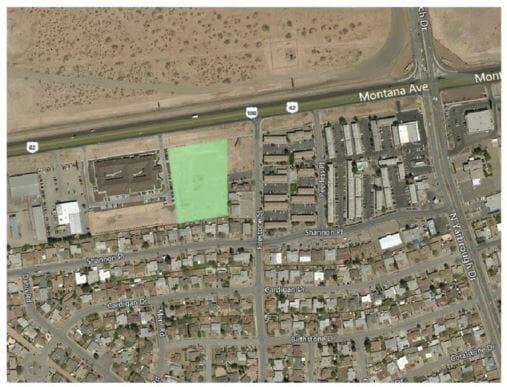
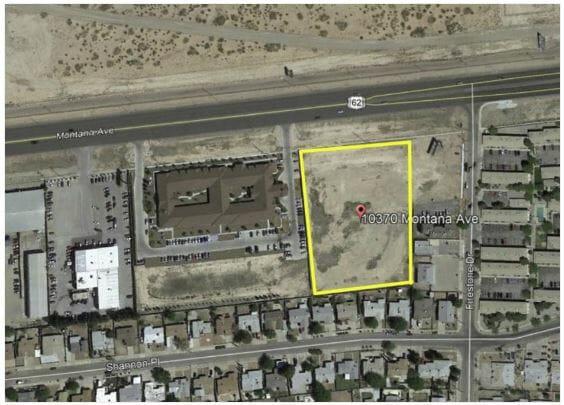
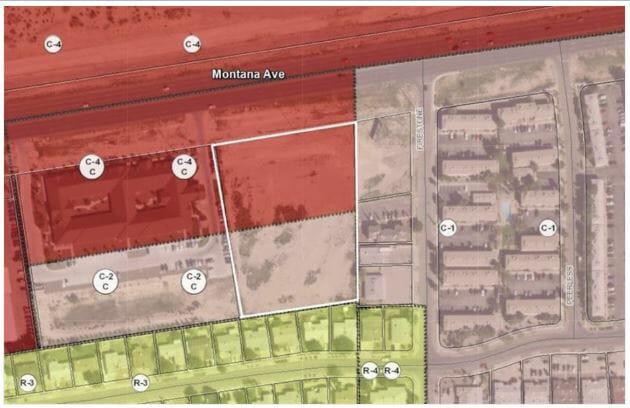
Property Description:The new gateway to Fort Bliss. This property is near the Yarbrough and Montana intersection. With the new connection to Global Reach, this property has become a key property for the development for the east-side. Located adjacent to the new McDonald's on the corner, this site is perfect for a start up business that needs good visibility. Traffic counts in this area have a count of over 40,000 cars daily. This property has a great location for an apartment complex or a shopping center. Montana will be expanded starting at this point.Primary FeaturesCounty: El PasoOff Market Date:Property Type: CommercialSold Date:Sold Price:Subdivision: Montana EstZoning: C4Financial DetailsApproximate Yearly Taxes: 11046Exemptions: NoneLease Info: Call Listing Office, NoneLease Terms: 12 Months, SaleLeaseable Area Y/N: noNumber Of Tenants:Packages Includes: Accounts PayableSale Includes: AssetsTax Year: 2017Tenant Pays: All UtilitiesAdditionalBest Use: Dental, Developed Land, Gas Station, Industrial, MedicalEmpowerment Zone: YesImproved: NoMeasured By: Appraiser CADProperty: Land (Fee Simple), See RemarksSource Dimensions: OtherVerification: OtherExternal FeaturesConstruction: See PlansDock:Finance Considered: Cash, ConventionalHandicap Access: NoLot:Lot SqFt:Miscellaneous Exterior: See RemarksNumber Of Parking Spaces:Parking: NoneProperty Access: Paved Road to PropUtilities: All CityInterior FeaturesCooling: NoneFinished Space:Heating: 2+ UnitsRefrigerated:Location InformationFlood Zone: NoLocation: Freestanding, See Remarks