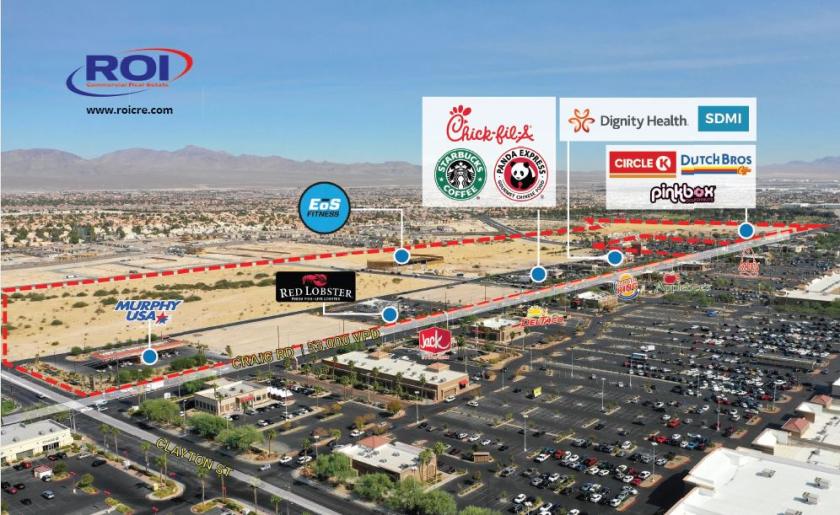
Commercial Land
1970 West Craig Road North Las Vegas, NV 89032
1970 West Craig Road North Las Vegas, NV 89032
Details & Description
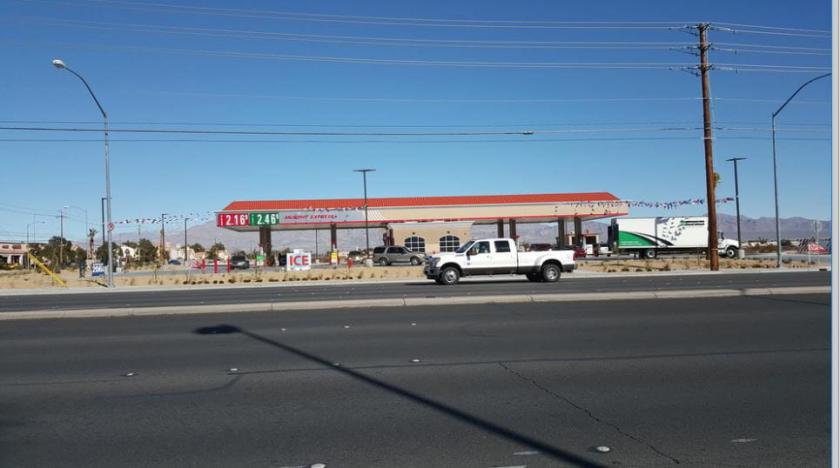
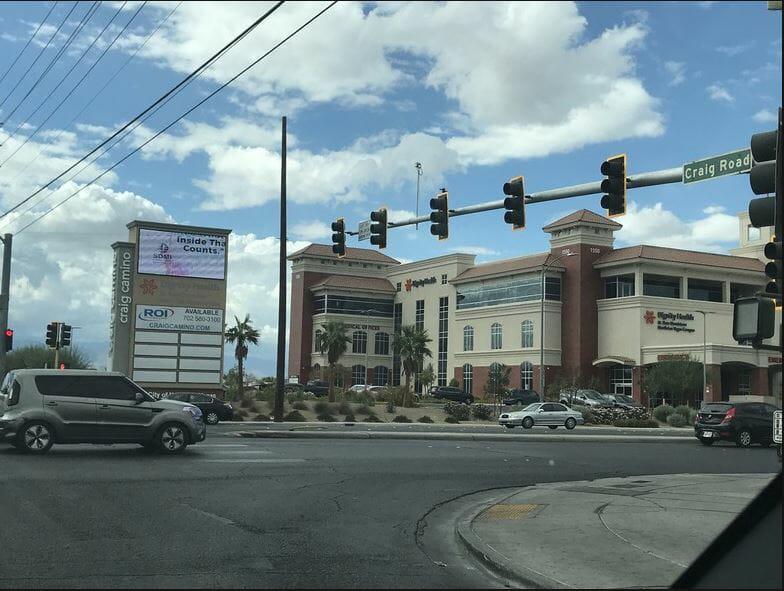
Additional Photos

Listing Agents

Daniel Adamson
O: 702-550-4934
dan@roicre.com
O: 702-550-4934
dan@roicre.com
While we strive to provide the most accurate information, all listing information, and demographic data, is provided by third-parties. As such, MyEListing will not be responsible for the accuracy of the information. It is strongly recommended that you verify all information with the listing agent, and any relevant agencies, prior to making any decisions.


