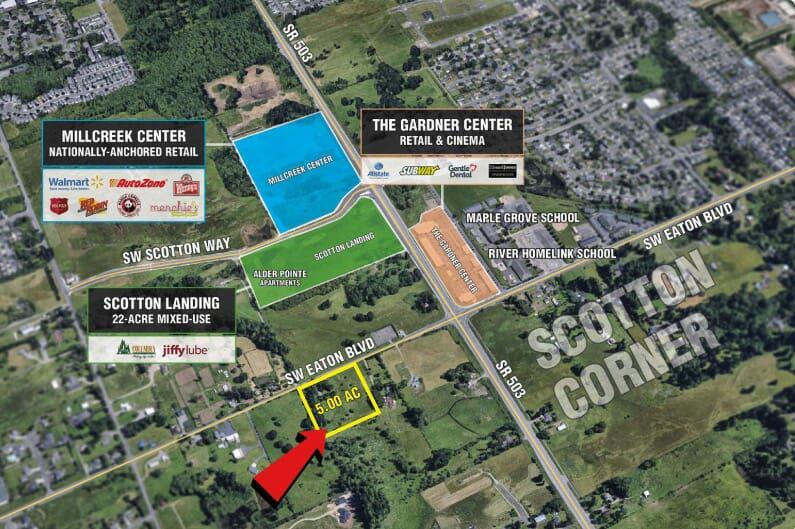
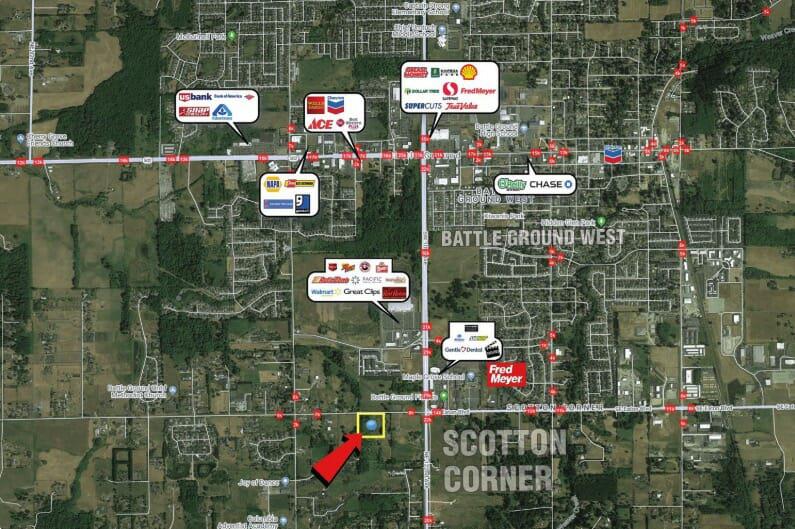
1-Mile | 3-Miles | 5-Miles | ||
---|---|---|---|---|
Total Population | 4,323 | 27,302 | 53,195 | |
Population Median Age | 35 | 36 | 38 | |
Population by Age | 0-9 Yrs | 656 (15%) | 4048 (14%) | 7701 (14%) |
10-19 Yrs | 583 (13%) | 4315 (15%) | 7917 (14%) | |
20-29 Yrs | 753 (17%) | 3587 (13%) | 6346 (11%) | |
30-39 Yrs | 533 (12%) | 3237 (11%) | 6049 (11%) | |
40-49 Yrs | 572 (13%) | 3895 (14%) | 6579 (12%) | |
50-59 Yrs | 575 (13%) | 3398 (12%) | 7413 (13%) | |
60-69 Yrs | 293 (6%) | 2635 (9%) | 6544 (12%) | |
70+ Yrs | 359 (8%) | 2187 (8%) | 4646 (8%) | |
Median HH Income | $62,569 | $74,993 | $83,173 | |
Total Household Income | < 24K | 260 (16%) | 1150 (12%) | 2054 (11%) |
25-49K | 396 (25%) | 1674 (18%) | 3042 (16%) | |
50-74K | 272 (17%) | 1749 (19%) | 3049 (16%) | |
75-99K | 240 (15%) | 1398 (15%) | 2831 (15%) | |
100-199K | 357 (22%) | 2693 (29%) | 5868 (32%) | |
200K+ | 46 (2%) | 481 (5%) | 1297 (7%) | |
Highest Education Level | No Diploma | 218 | 1144 | 2214 |
Diploma or GED | 705 | 4598 | 8604 | |
Some College | 829 | 4786 | 9360 | |
Assoc. Degree | 278 | 2246 | 3975 | |
Bachelors Degree | 501 | 2942 | 6736 | |
Higher Degree | 160 | 1249 | 3345 | |
Total Housing Units | 1,686 | 9,651 | 19,054 | |
--Owner-Occupied | 1,018 | 6,880 | 14,267 | |
--Renter-Occupied | 553 | 2,265 | 3,873 | |
Owner-Occupied Values | < 100K | 116 | 387 | 612 |
100-199K | 139 | 679 | 1083 | |
200-299K | 411 | 2525 | 3861 | |
300-399K | 167 | 1528 | 3479 | |
400-499K | 73 | 753 | 2424 | |
500K+ | 112 | 1007 | 2808 | |
Total Working Age Population | 3,311 | 20,539 | 40,336 | |
In Work Force | 2,113 | 13,293 | 25,502 | |
Not In Work Force | 1,197 | 7,246 | 14,834 | |
Workforce Employed | 2,006 | 12,678 | 24,346 | |
Workforce Unemployed | 107 | 615 | 1,153 | |
Civlian Workforce | 2,113 | 13,293 | 25,499 | |
Military Workforce | 0 | 0 | 3 | |
Total Households | 1,570 | 9,144 | 18,140 | |
Family Households | 1,147 | 6,936 | 14,138 | |
Non-Family Households | 423 | 2,209 | 4,002 | |
Married Couple | 869 | 5,524 | 11,744 | |
Other Family | 278 | 1,412 | 2,393 | |
Married w/Child | 419 | 2,558 | 4,888 | |
Single Male w/Child | 26 | 238 | 362 | |
Single Female w/Child | 63 | 423 | 808 |
Population Change Last Two Decades - Plus Projection
2000 | % | 2010 | % | 2020 | % | 2030 | |
---|---|---|---|---|---|---|---|
Washington | 5,894,121 | +14 | 6,724,540 | +14 | 7,638,415 | +11 | 8,503,178 |
Clark County | 345,238 | +23 | 425,363 | +17 | 499,400 | +16 | 576,879 |
Total Working Age Population:
Total Households:
Total Working Age Population:
Total Households:
Total Working Age Population:
Total Households: