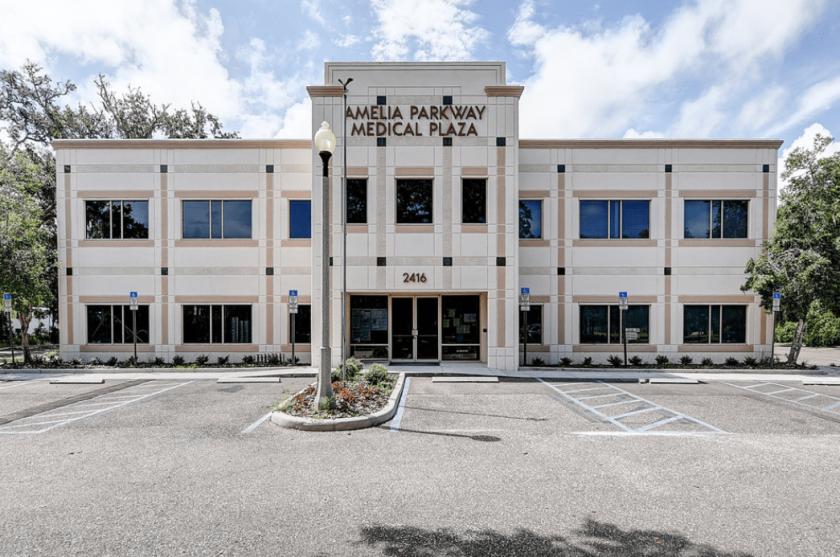
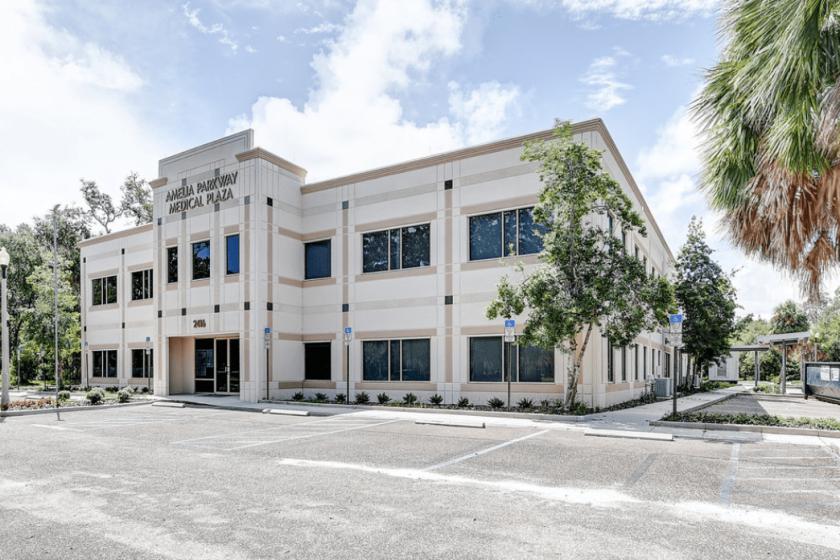
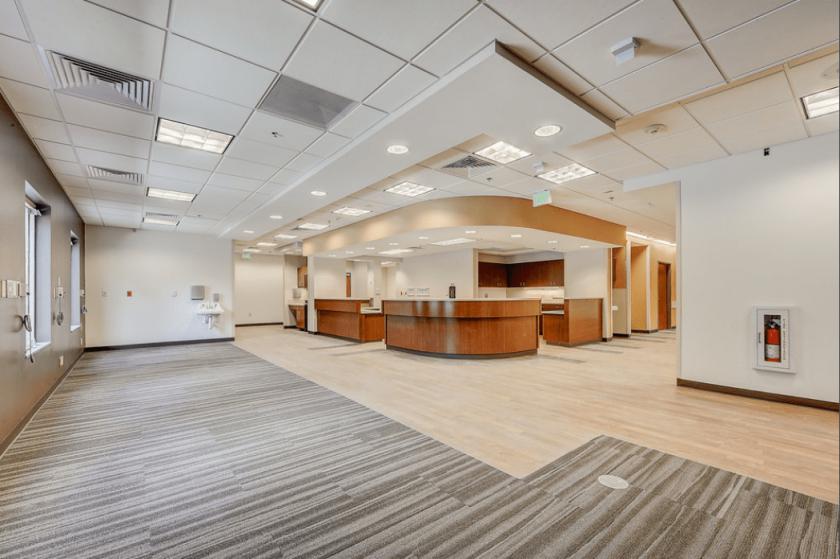
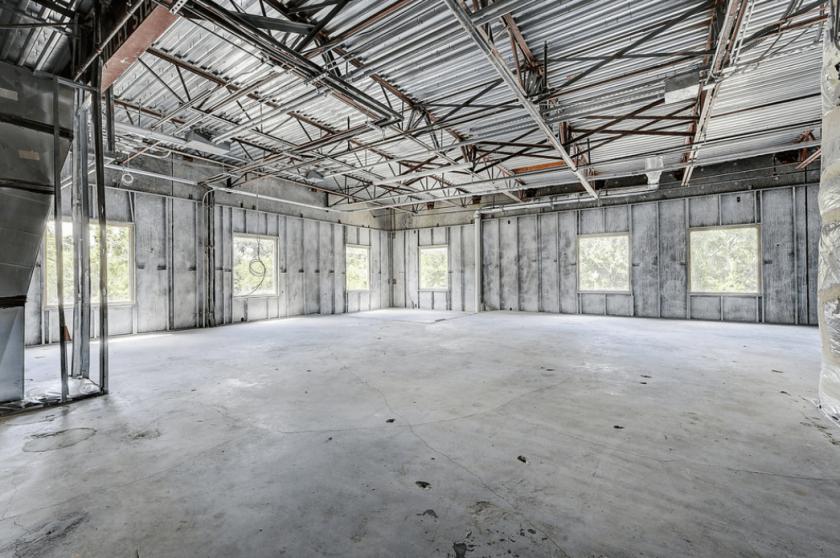
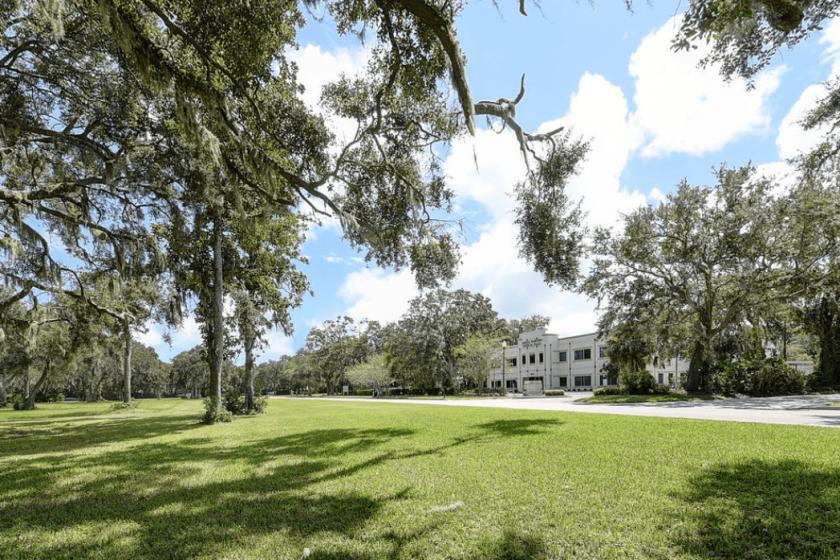
OverviewIntroducing this gorgeous and newly renovated build-to-suit medical office located in Fernandina Beach, FL. With 13 miles of pristine beaches, abundant wildlife and clear, calm waters. Amelia Island is known for it's quaint charm and has been a beloved destination for generations. It's upscale resorts and world-class spas combined with a charming collection of bed and breakfasts, historic sites and captivating festivals make for an experience that’s uniquely Floridian. Fernandina Beach and Amelia Island have consistently been among Florida’s highest-ranked island destinations.The Boston Globe may have said it best: "The living is easy on Amelia Island. Discriminating retirees who value the pace of a charming small town but still want the best in (and easy access to) services, well-priced housing options, and convenient transportation will want to take a close look at Amelia Island."HighlightsFull 30,000 SF building available for leaseSuites can be customized to fit your specific space requirements.Strategically located next to the Fernandina Beach Municipal Airport.Abundant parkingLocated minutes from historic downtown Fernandina and resorts such as the Ritz Carlton and Omni Hotel. Only 25 minutes to Jacksonville.BrokersMatthew ClarkSenior Vice Presidentmclark@primerealtyinc.comT: 904.239.5269Melissa CainAssociate Directormcain@primerealtyinc.comT: 904.373.9642Aaron CainAssociate Directoracain@primerealtyinc.comT: 904.239.5250