Industrial Properties
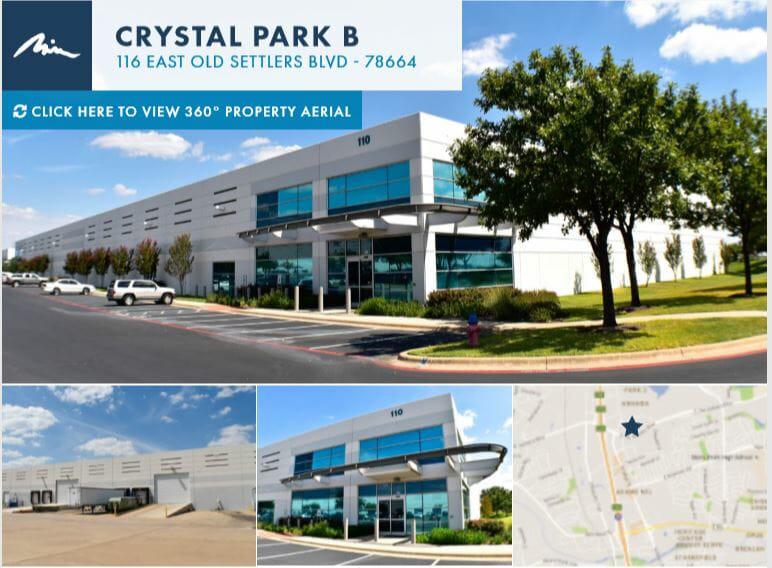
116 East Old Settlers Boulevard Round Rock, TX 78664
116 East Old Settlers Boulevard Round Rock, TX 78664
Details & Description
Listing Agents

Davis Bass
O: 512-538-1030
bass@hpitx.com
O: 512-538-1030
bass@hpitx.com
While we strive to provide the most accurate information, all listing information, and demographic data, is provided by third-parties. As such, MyEListing will not be responsible for the accuracy of the information. It is strongly recommended that you verify all information with the listing agent, and any relevant agencies, prior to making any decisions.