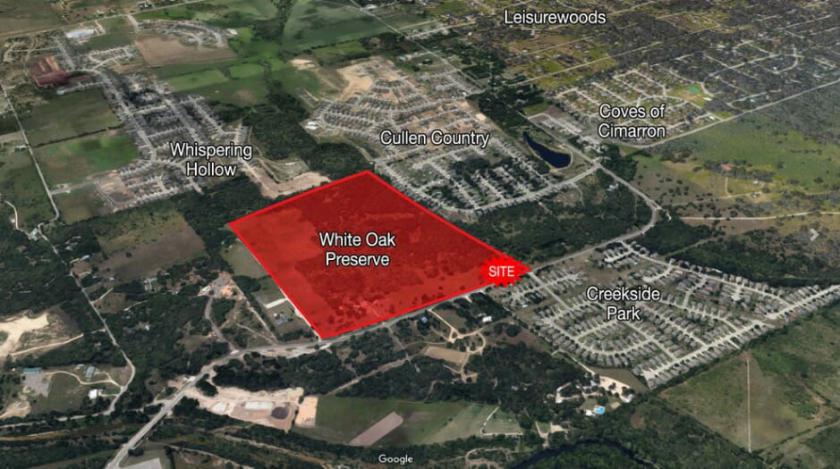
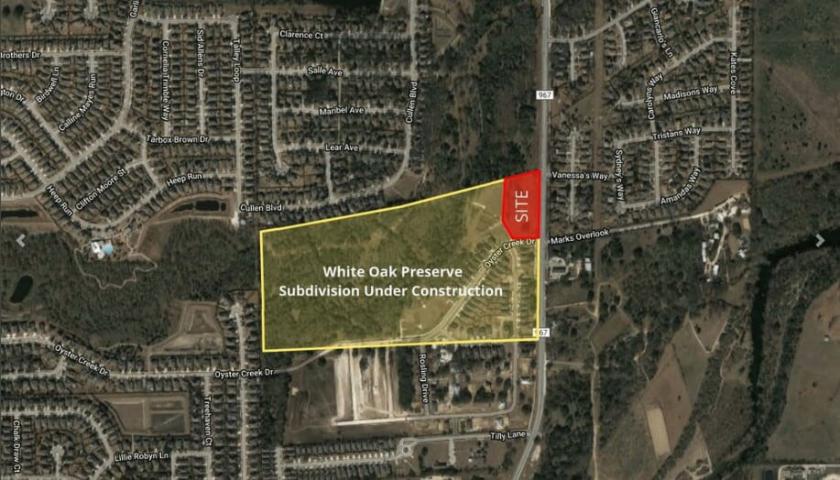
1-Mile | 3-Miles | 5-Miles | ||
---|---|---|---|---|
Total Population | 3,859 | 20,561 | 62,338 | |
Population Median Age | 35 | 36 | 36 | |
Population by Age | 0-9 Yrs | 696 (18%) | 3341 (16%) | 9365 (15%) |
10-19 Yrs | 396 (10%) | 2191 (10%) | 7552 (12%) | |
20-29 Yrs | 439 (11%) | 2446 (11%) | 7299 (11%) | |
30-39 Yrs | 747 (19%) | 3861 (18%) | 11509 (18%) | |
40-49 Yrs | 614 (15%) | 2797 (13%) | 8865 (14%) | |
50-59 Yrs | 417 (10%) | 2540 (12%) | 7493 (12%) | |
60-69 Yrs | 367 (9%) | 2113 (10%) | 6309 (10%) | |
70+ Yrs | 184 (4%) | 1271 (6%) | 3947 (6%) | |
Median HH Income | $89,268 | $87,384 | $88,818 | |
Total Household Income | < 24K | 152 (10%) | 683 (9%) | 1779 (8%) |
25-49K | 213 (14%) | 1077 (14%) | 3170 (14%) | |
50-74K | 218 (14%) | 1295 (17%) | 3687 (16%) | |
75-99K | 267 (18%) | 1487 (19%) | 4091 (18%) | |
100-199K | 525 (35%) | 2535 (33%) | 7272 (33%) | |
200K+ | 95 (6%) | 507 (6%) | 1795 (8%) | |
Highest Education Level | No Diploma | 95 | 658 | 2732 |
Diploma or GED | 396 | 2759 | 9122 | |
Some College | 621 | 3236 | 9330 | |
Assoc. Degree | 109 | 759 | 2548 | |
Bachelors Degree | 973 | 4533 | 12587 | |
Higher Degree | 372 | 1983 | 5901 | |
Total Housing Units | 1,501 | 7,869 | 22,855 | |
--Owner-Occupied | 1,063 | 5,723 | 16,533 | |
--Renter-Occupied | 408 | 1,862 | 5,260 | |
Owner-Occupied Values | < 100K | 26 | 271 | 735 |
100-199K | 166 | 1080 | 3381 | |
200-299K | 575 | 2777 | 7075 | |
300-399K | 266 | 1213 | 3427 | |
400-499K | 20 | 233 | 1156 | |
500K+ | 9 | 150 | 759 | |
Total Working Age Population | 2,913 | 15,836 | 48,137 | |
In Work Force | 2,239 | 11,793 | 34,832 | |
Not In Work Force | 674 | 4,043 | 13,304 | |
Workforce Employed | 2,166 | 11,384 | 33,640 | |
Workforce Unemployed | 73 | 379 | 1,058 | |
Civlian Workforce | 2,239 | 11,762 | 34,698 | |
Military Workforce | 0 | 31 | 135 | |
Total Households | 1,471 | 7,584 | 21,793 | |
Family Households | 1,031 | 5,474 | 15,937 | |
Non-Family Households | 440 | 2,110 | 5,856 | |
Married Couple | 912 | 4,699 | 13,091 | |
Other Family | 119 | 775 | 2,847 | |
Married w/Child | 519 | 2,316 | 6,192 | |
Single Male w/Child | 0 | 120 | 505 | |
Single Female w/Child | 69 | 372 | 1,216 |
Population Change Last Two Decades - Plus Projection
2000 | % | 2010 | % | 2020 | % | 2030 | |
---|---|---|---|---|---|---|---|
Texas | 20,851,820 | +21 | 25,145,561 | +18 | 29,677,668 | +18 | 34,894,452 |
Travis County | 812,280 | +26 | 1,024,266 | +26 | 1,291,502 | +19 | 1,540,812 |
Hays County | 97,589 | +61 | 157,107 | +50 | 234,896 | +48 | 347,120 |
Total Working Age Population:
Total Households:
Total Working Age Population:
Total Households:
Total Working Age Population:
Total Households: