Industrial Properties
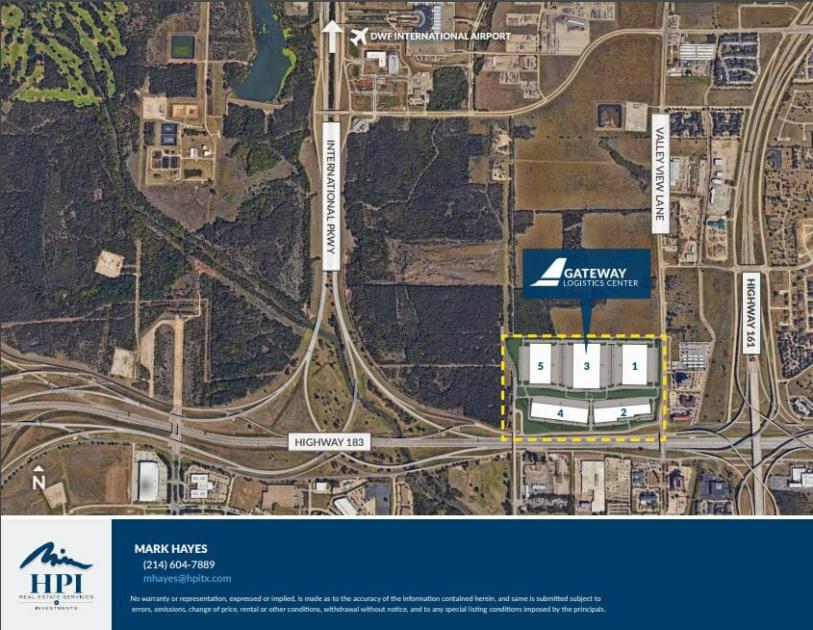
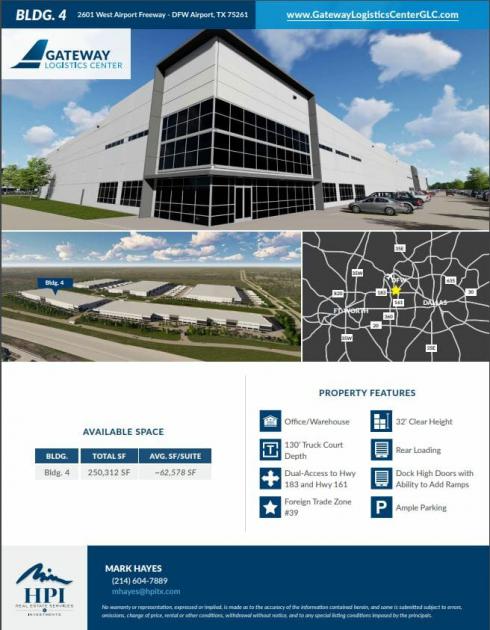
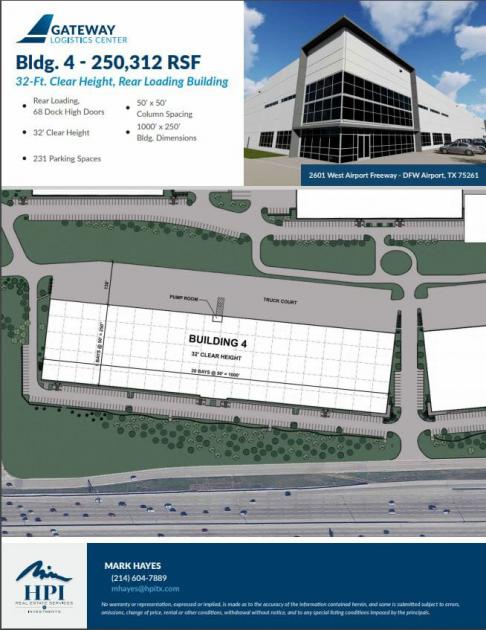
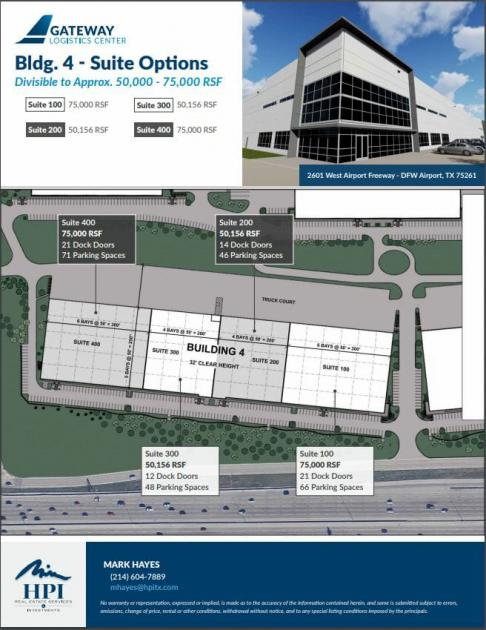
5683 West Airport Freeway Irving, TX 75062
5683 West Airport Freeway Irving, TX 75062
Details & Description
Additional Photos
Listing Agents

Mark Hayes
O: 214-604-7889
mhayes@banderaventures.com
O: 214-604-7889
mhayes@banderaventures.com
While we strive to provide the most accurate information, all listing information, and demographic data, is provided by third-parties. As such, MyEListing will not be responsible for the accuracy of the information. It is strongly recommended that you verify all information with the listing agent, and any relevant agencies, prior to making any decisions.