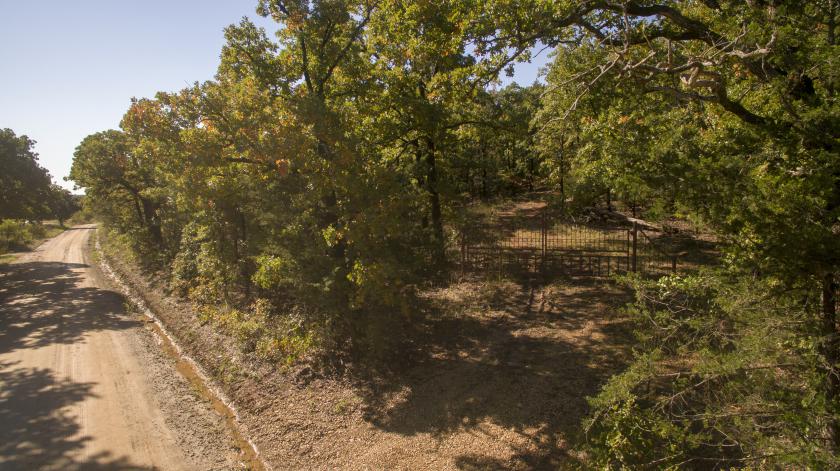
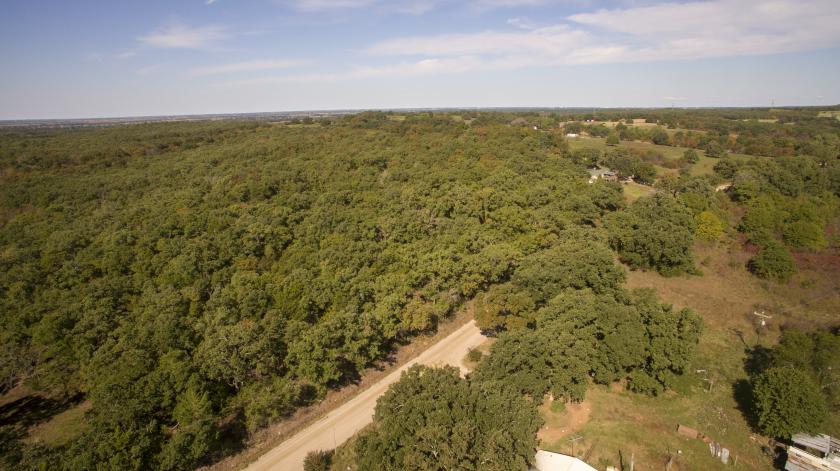
1-Mile | 3-Miles | 5-Miles | ||
---|---|---|---|---|
Total Population | 98 | 889 | 4,926 | |
Population Median Age | 45 | 46 | 48 | |
Population by Age | 0-9 Yrs | 8 (8%) | 69 (7%) | 388 (7%) |
10-19 Yrs | 17 (17%) | 126 (14%) | 523 (10%) | |
20-29 Yrs | 0 (0%) | 32 (3%) | 386 (7%) | |
30-39 Yrs | 11 (11%) | 80 (8%) | 420 (8%) | |
40-49 Yrs | 13 (13%) | 118 (13%) | 504 (10%) | |
50-59 Yrs | 12 (12%) | 119 (13%) | 654 (13%) | |
60-69 Yrs | 30 (30%) | 240 (26%) | 1146 (23%) | |
70+ Yrs | 8 (8%) | 105 (11%) | 905 (18%) | |
Median HH Income | $97,973 | $93,598 | $77,966 | |
Total Household Income | < 24K | 3 (6%) | 35 (9%) | 287 (13%) |
25-49K | 4 (9%) | 48 (12%) | 446 (21%) | |
50-74K | 3 (6%) | 38 (10%) | 272 (13%) | |
75-99K | 11 (25%) | 92 (24%) | 306 (14%) | |
100-199K | 16 (37%) | 130 (34%) | 636 (30%) | |
200K+ | 4 (9%) | 36 (9%) | 136 (6%) | |
Highest Education Level | No Diploma | 2 | 30 | 254 |
Diploma or GED | 19 | 180 | 976 | |
Some College | 19 | 176 | 1025 | |
Assoc. Degree | 10 | 76 | 365 | |
Bachelors Degree | 18 | 163 | 783 | |
Higher Degree | 5 | 52 | 387 | |
Total Housing Units | 43 | 388 | 2,278 | |
--Owner-Occupied | 41 | 355 | 1,809 | |
--Renter-Occupied | 1 | 24 | 275 | |
Owner-Occupied Values | < 100K | 9 | 80 | 375 |
100-199K | 10 | 81 | 395 | |
200-299K | 8 | 69 | 460 | |
300-399K | 6 | 50 | 246 | |
400-499K | 2 | 19 | 98 | |
500K+ | 7 | 55 | 236 | |
Total Working Age Population | 81 | 752 | 4,228 | |
In Work Force | 53 | 466 | 2,247 | |
Not In Work Force | 27 | 285 | 1,981 | |
Workforce Employed | 53 | 455 | 2,158 | |
Workforce Unemployed | 0 | 11 | 89 | |
Civlian Workforce | 53 | 466 | 2,247 | |
Military Workforce | 0 | 0 | 0 | |
Total Households | 43 | 378 | 2,084 | |
Family Households | 31 | 283 | 1,576 | |
Non-Family Households | 12 | 95 | 508 | |
Married Couple | 30 | 263 | 1,400 | |
Other Family | 1 | 20 | 176 | |
Married w/Child | 11 | 86 | 337 | |
Single Male w/Child | 0 | 0 | 0 | |
Single Female w/Child | 1 | 10 | 46 |
Population Change Last Two Decades - Plus Projection
2000 | % | 2010 | % | 2020 | % | 2030 | |
---|---|---|---|---|---|---|---|
Texas | 20,851,820 | +21 | 25,145,561 | +18 | 29,677,668 | +18 | 34,894,452 |
Cooke County | 36,363 | +6 | 38,437 | +3 | 39,727 | +2 | 40,626 |
Total Working Age Population:
Total Households:
Total Working Age Population:
Total Households:
Total Working Age Population:
Total Households: