Homelessness in the United States: A State-by-State Comparative Analysis

Specializes in providing actionable insights into the commercial real estate space for investors, brokers, lessors, and lessees. He covers quarterly market data reports, investment strategies, how-to guides, and top-down perspectives on market movements.

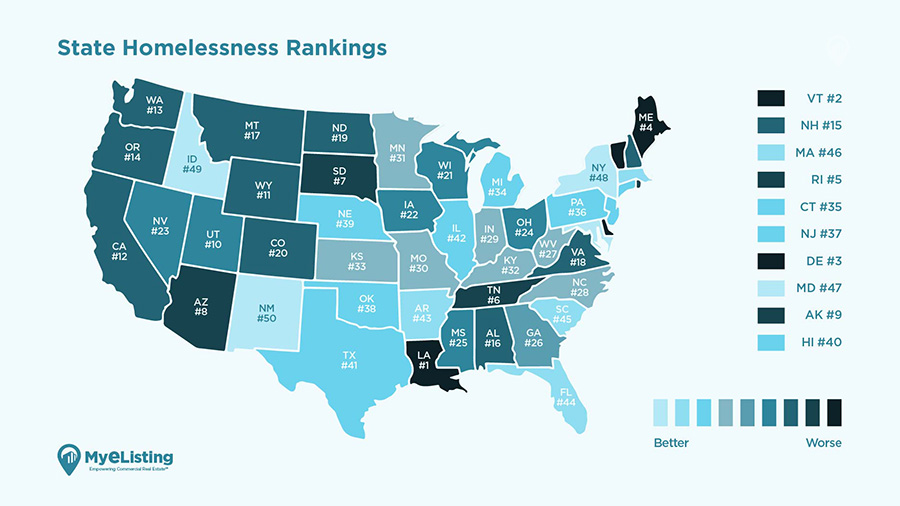
The ramifications of homelessness continue to devastate individuals, households, families, and communities in the US: In 2022, there were 582,462 homeless persons in the United States, representing a rate of 17 homeless persons per 10,000 people, a 0.01% increase from 2019.
The data on homelessness in the United States in 2022 provides insight into the scope and nature of this issue, highlighting the urgent need for comprehensive, coordinated solutions. This data reveals significant variation in rates and experiences across states, as well as the high percentage of individuals experiencing homelessness who are unsheltered or in families.
When examining state-level data, significant variations emerge, with some states experiencing substantial increases in homelessness rates. Here is what we found.
Here are some key observations:
- The total homeless rate per 10,000 population has increased slightly by 0.01%, indicating that there has been no significant improvement in reducing homelessness on a national level.
- Louisiana had the highest increase in homelessness rate per 10,000 people, with a 154% increase from 2019 to 2022. Vermont and Delaware also experienced significant increases in their homelessness rates: 146% since 2019.
- Idaho, New Mexico, and New York experienced the most significant reduction in homelessness rates since 2019, a decrease of 20%, 22%, and 20%, respectively.
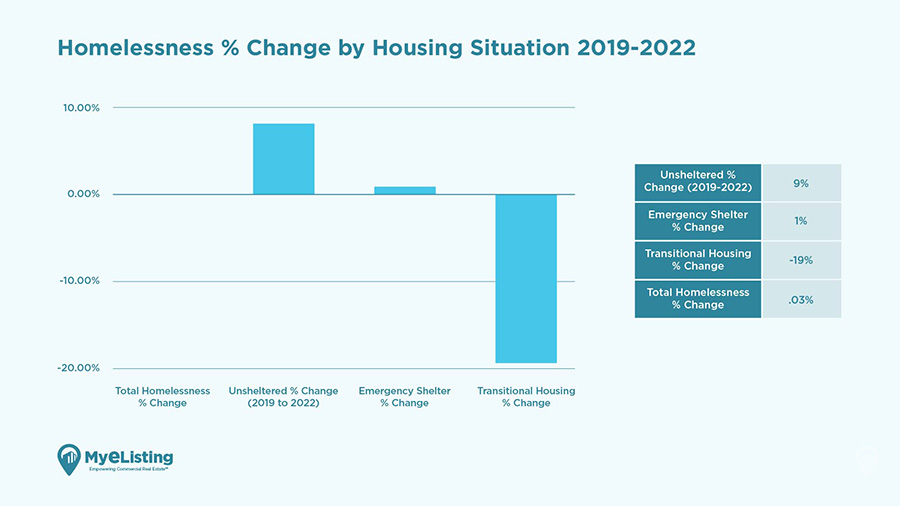
- 40% of people experiencing homelessness in 2022 are unsheltered, a 9% increase since 2019; 49% are in emergency shelters, a 1% increase; and 11% are in transitional housing, a 19% decrease since 2019.
- States in the West and Northeast tended to have higher rates of homelessness than those in the Midwest and South. California, Oregon, and Washington in the West all had rates above 30 homeless persons per 10,000 state population. While the Northeast states of Vermont, Rhode Island, and Massachusetts also had high rates.
Before diving into state-level data, let’s look at the national data to create a complete picture of homelessness in the United States.
National Changes in Homeless Since 2019
Homeless living data in the United States reveals a 9% increase (approximately 10,000 more people) between 2019 and 2022 in the unsheltered homeless population. This means that more people live on the streets, in cars, or in other places not meant for human habitation.
Meanwhile, the percentage of homeless individuals living in emergency shelters increased by 1% between 2019 and 2022. The number of homeless seeking shelter continues to outpace the number of emergency shelters available to house them.
Even more concerning: The data shows fewer homeless individuals are using transitional housing (approximately a 19% decrease between 2019 and 2022). Transitional housing provides individuals with temporary housing and support services to help them transition to permanent housing. This decrease may be due to funding cuts or changes in policy that have made it more challenging to access transitional housing.
The total homelessness rate has remained relatively unchanged, with a .03% increase from 2019 to 2022. However, the increase in unsheltered individuals and the decrease in transitional housing usage underscores the urgent need for comprehensive, coordinated solutions to address homelessness in the United States.
Homelessness % Change by Housing Situation 2019-2022
| Population | % Change (2019 to 2022) |
|---|---|
| Unsheltered | 9% |
| Emergency Shelter | 1% |
| Transitional Housing | -19% |
| Total Homelessness | .03% |
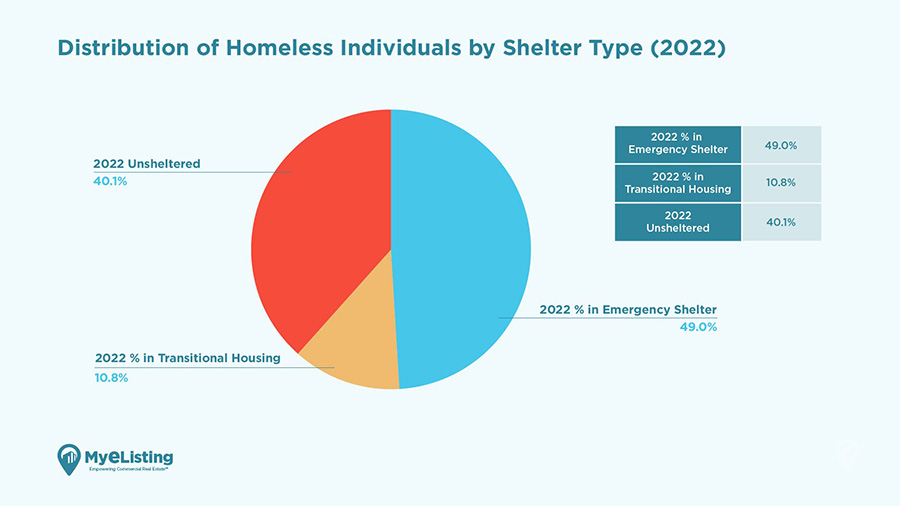
Distribution of Homeless Individuals by Shelter Type (2022)
The data on homelessness in the United States in 2022 reveals that, of the estimated 582,462 individuals experiencing homelessness, nearly half, or 49%, were in emergency shelters.
Meanwhile, 11% were in transitional housing, which provides individuals with temporary housing and support services to help them transition to permanent housing.
The most concerning statistic is 40% of individuals experiencing homelessness were unsheltered.
| Population | % of Total Homelessness |
|---|---|
| Emergency Shelter | 49% |
| Transitional Housing | 11% |
| Unsheltered | 40% |
Homelessness % Changes by State from 2019 to 2022
Below, we’ve ranked each state according to the percentage change in homelessness rates since 2019, starting with the states with the most significant increases.
The table also illustrates the total number of homeless people per 10,000 in 2022 and 2019 and a breakdown of homeless individuals living in emergency shelters, transitional housing, and unsheltered locations.
| Rank | State | Homelessness % Change | 2022 Homelessness Rate | 2019 Homelessness Rate | Emergency Shelter % Change | Transitional Housing % Change | Unsheltered % Change |
|---|---|---|---|---|---|---|---|
| -- | United States | 0.01% | 17.48 | 17.30 | 1% | -19% | 9% |
| 1 | Louisiana | 154% | 16.06 | 6.33 | 345% | -36% | 28% |
| 2 | Vermont | 146% | 42.96 | 17.45 | 201% | -20% | -62% |
| 3 | Delaware | 146% | 23.26 | 9.46 | 216% | -7% | 55% |
| 4 | Maine | 103% | 31.84 | 15.67 | 188% | 4% | 68% |
| 5 | Rhode Island | 45% | 14.42 | 9.96 | 50% | -29% | 238% |
| 6 | Tennessee | 37% | 14.99 | 10.93 | 6% | -47% | 129% |
| 7 | South Dakota | 36% | 15.27 | 11.25 | 36% | 13% | 42% |
| 8 | Arizona | 34% | 18.42 | 13.75 | 12% | -22% | 75% |
| 9 | Alaska | 21% | 31.63 | 26.07 | 31% | -13% | 30% |
| 10 | Utah | 21% | 10.52 | 8.73 | 7% | 5% | 103% |
| 11 | Wyoming | 18% | 11.15 | 9.47 | 83% | -38% | -49% |
| 12 | California | 15% | 43.95 | 38.29 | 47% | -4% | 8% |
| 13 | Washington | 14% | 32.38 | 28.34 | 12% | -22% | 30% |
| 14 | Oregon | 13% | 42.35 | 37.64 | 35% | -11% | 9% |
| 15 | New Hampshire | 12% | 11.50 | 10.27 | 9% | -20% | 116% |
| 16 | Alabama | 11% | 7.39 | 6.65 | 5% | -10% | 28% |
| 17 | Montana | 11% | 14.12 | 12.70 | 35% | -19% | -19% |
| 18 | Virginia | 11% | 7.52 | 6.78 | 25% | -28% | -22% |
| 19 | North Dakota | 7% | 7.83 | 7.31 | -1% | -17% | 576% |
| 20 | Colorado | 7% | 17.80 | 16.70 | 3% | -17% | 42% |
| 21 | Wisconsin | 4% | 8.10 | 7.79 | 17% | -29% | 1% |
| 22 | Iowa | 3% | 7.56 | 7.34 | 5% | -28% | 113% |
| 23 | Nevada | 3% | 23.97 | 23.27 | 33% | -23% | -9% |
| 24 | Ohio | 2% | 9.06 | 8.85 | -1% | -7% | 29% |
| 25 | Mississippi | 2% | 4.07 | 3.98 | -24% | -56% | 59% |
| 26 | Georgia | 0% | 9.79 | 9.84 | -27% | -16% | 39% |
| 27 | West Virginia | -1% | 7.75 | 7.80 | -19% | 22% | 62% |
| 28 | North Carolina | -1% | 8.77 | 8.88 | -19% | -25% | 57% |
| 29 | North Carolina | -2% | 7.97 | 8.13 | 6% | -37% | 23% |
| 30 | Missouri | -2% | 10.02 | 10.23 | -19% | -4% | 62% |
| 31 | Minnesota | -2% | 13.85 | 14.14 | 2% | -18% | 6% |
| 32 | Kentucky | -3% | 8.83 | 9.13 | -14% | -7% | 38% |
| 33 | Kansas | -4% | 7.48 | 7.82 | -20% | -1% | 44% |
| 34 | Michigan | -5% | 8.18 | 8.59 | -2% | -27% | 35% |
| 35 | Connecticut | -5% | 8.08 | 8.51 | 7% | -30% | -37% |
| 36 | Pennsylvania | -5% | 9.78 | 10.31 | 2% | -23% | -3% |
| 37 | New Jersey | -5% | 9.45 | 9.98 | 10% | -27% | -37% |
| 38 | Oklahoma | -6% | 9.34 | 9.97 | -14% | -1% | 5% |
| 39 | Nebraska | -7% | 11.41 | 12.23 | 1% | -37% | 93% |
| 40 | Hawaii | -9% | 41.43 | 45.29 | -8% | -39% | 1% |
| 41 | Texas | -9% | 8.14 | 8.91 | -5% | -29% | -6% |
| 42 | Illinois | -9% | 7.32 | 8.05 | -9% | -18% | 1% |
| 43 | Arkansas | -10% | 8.07 | 9.00 | -6% | -27% | -9% |
| 44 | Florida | -12% | 11.67 | 13.19 | -7% | -25% | -9% |
| 45 | South Carolina | -16% | 6.83 | 8.10 | 1% | -25% | -30% |
| 46 | Massachusetts | -17% | 22.21 | 26.80 | -18% | -29% | 35% |
| 47 | Maryland | -20% | 8.68 | 10.85 | -8% | -35% | -35% |
| 48 | New York | -20% | 37.70 | 47.34 | -22% | -12% | -1% |
| 49 | Idaho | -20% | 10.30 | 12.95 | -25% | -17% | -17% |
| 50 | New Mexico | -22% | 12.11 | 15.46 | 6% | -24% | -56% |
2022 State Homelessness Data
This data table provides a detailed breakdown of each state’s homeless population, including the total number of homeless individuals and the percentage of individuals living in different types of shelters.
The data also shows the rate of homelessness per 10,000 people in each state, which can be used to compare homelessness rates across different states.
| State | 2022 Total Homeless | Homelessness Per 10k | 2022 Unsheltered % | 2022 % in Emergency Shelter | 2022 % in Transitional Housing |
|---|---|---|---|---|---|
| United States | 582,462 | 17 | 40% | 49% | 11% |
| Alabama | 3,752 | 7 | 42% | 44% | 14% |
| Alaska | 2,320 | 32 | 15% | 69% | 16% |
| Arizona | 13,553 | 18 | 59% | 29% | 12% |
| Arkansas | 2,459 | 8 | 53% | 37% | 11% |
| California | 171,521 | 44 | 67% | 26% | 7% |
| Colorado | 10,397 | 18 | 30% | 49% | 21% |
| Connecticut | 2,930 | 8 | 10% | 79% | 11% |
| Delaware | 2,369 | 23 | 7% | 85% | 9% |
| Florida | 25,959 | 12 | 45% | 39% | 16% |
| Georgia | 10,689 | 10 | 52% | 31% | 17% |
| Hawaii | 5,967 | 41 | 63% | 25% | 12% |
| Idaho | 1,998 | 10 | 44% | 41% | 15% |
| Illinois | 9,212 | 7 | 21% | 58% | 21% |
| Indiana | 5,449 | 8 | 15% | 71% | 14% |
| Iowa | 2,419 | 8 | 17% | 61% | 23% |
| Kansas | 2,196 | 7 | 26% | 50% | 24% |
| Kentucky | 3,984 | 9 | 27% | 60% | 12% |
| Louisiana | 7,373 | 16 | 17% | 78% | 6% |
| Maine | 4,411 | 32 | 4% | 74% | 22% |
| Maryland | 5,349 | 9 | 17% | 64% | 20% |
| Massachusetts | 15,507 | 22 | 7% | 83% | 9% |
| Michigan | 8,206 | 8 | 11% | 72% | 17% |
| Minnesota | 7,917 | 14 | 22% | 56% | 22% |
| Mississippi | 1,196 | 4 | 64% | 26% | 10% |
| Missouri | 6,193 | 10 | 28% | 51% | 21% |
| Montana | 1,585 | 14 | 18% | 68% | 14% |
| Nebraska | 2,246 | 11 | 10% | 70% | 21% |
| Nevada | 7,618 | 24 | 47% | 43% | 10% |
| New Hampshire | 1,605 | 12 | 21% | 58% | 22% |
| New Jersey | 8,752 | 9 | 11% | 73% | 16% |
| New Mexico | 2,560 | 12 | 22% | 67% | 11% |
| New York | 74,178 | 38 | 5% | 88% | 6% |
| North Carolina | 9,382 | 9 | 39% | 49% | 13% |
| North Dakota | 610 | 8 | 14% | 65% | 21% |
| Ohio | 10,654 | 9 | 18% | 69% | 13% |
| Oklahoma | 3,754 | 9 | 35% | 51% | 14% |
| Oregon | 17,959 | 42 | 62% | 28% | 10% |
| Pennsylvania | 12,691 | 10 | 13% | 66% | 22% |
| Rhode Island | 1,577 | 14 | 16% | 73% | 11% |
| South Carolina | 3,608 | 7 | 34% | 52% | 13% |
| South Dakota | 1,389 | 15 | 25% | 69% | 7% |
| Tennessee | 10,567 | 15 | 58% | 33% | 8% |
| Texas | 24,432 | 8 | 45% | 44% | 11% |
| Utah | 3,557 | 11 | 25% | 62% | 13% |
| Vermont | 2,780 | 43 | 2% | 94% | 4% |
| Virginia | 6,529 | 8 | 10% | 81% | 8% |
| Washington | 25,211 | 32 | 50% | 38% | 12% |
| West Virginia | 1,375 | 8 | 29% | 60% | 11% |
| Wisconsin | 4,775 | 8 | 6% | 76% | 18% |
| Wyoming | 648 | 11 | 10% | 75% | 15% |
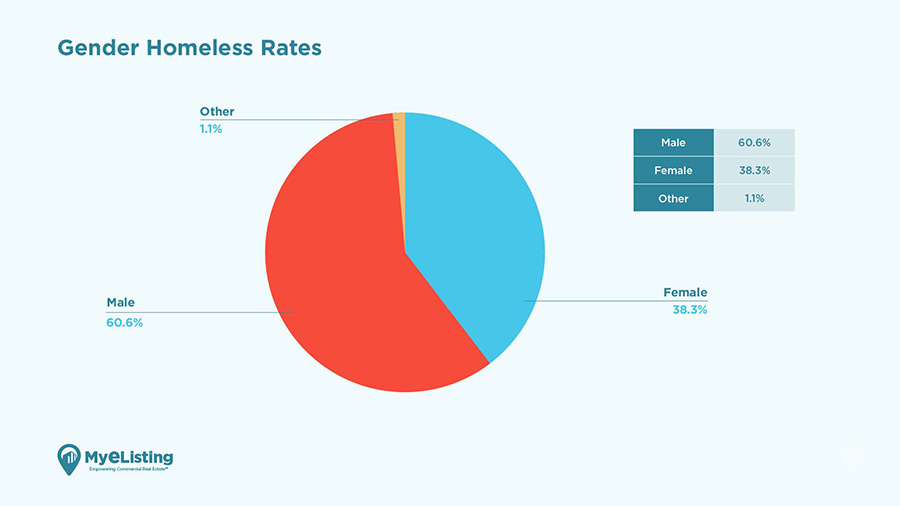
Homelessness by Gender
The gender breakdown of individuals experiencing homelessness in 2022 reveals that most homeless people in the United States are male, accounting for 60.6% of the total. Meanwhile, females comprise 38.3% of the total, and individuals identifying as "Other" account for 1.1%.
2022 Homelessness Rates by Gender
| Gender | 2022 % of Total |
|---|---|
| Female | 38.3% |
| Male | 60.6% |
| Other | 1.1% |
Vulnerable Homelessness Subpopulation Data
The data provides insight into populations particularly vulnerable to homelessness, including individuals with severe mental illness, chronic substance abuse, veterans, and others.
| Population Summary | 2022 % of Total |
|---|---|
| Severely Mentally Ill | 21.1% |
| Chronic Substance Abuse | 16.3% |
| Veterans | 5.7% |
| HIV/AIDS | 1.7% |
| Victims of Domestic Violence | 8.3% |
| Unaccompanied Youth | 5.2% |
| Parenting Youth | 1.1% |
| Children of Parenting Youth | 1.4% |
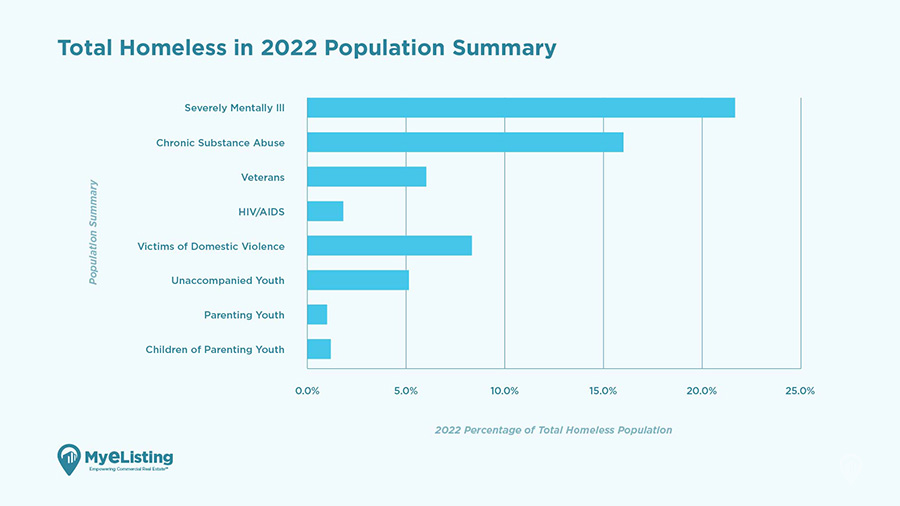
The chart above shows that 1 in 5 homeless people are severely mentally ill, 16.3% (1 in 6) have chronic substance abuse, and 8.3% (1 in 12) are victims of domestic violence. This highlights the importance of providing not only affordable housing but supportive services and policies to address these underlying issues and root causes of homelessness
Homelessness Subtypes: Emergency Shelter, Transitional Housing, and Unsheltered
Emergency shelters provide temporary housing for individuals experiencing homelessness, while transitional housing offers longer-term accommodation and support services. Unsheltered homelessness refers to individuals living without shelter in public spaces like parks or sidewalks.
Overall Homelessness
States with higher rates of homelessness tend to have higher rates of poverty and income inequality. For example, Louisiana, which has the highest rate of homelessness per 10,000 population, also has one of the highest poverty rates in the country. Louisiana had the highest increase in total homelessness per 10k with a percentage change of 154%, followed by Vermont and Delaware with a percentage change of 146%.
Similarly, California, New York and Massachusetts, which have some of the highest rates of homelessness, also have some of the highest levels of income inequality. California, with a homelessness rate of 43.95 per 10,000 population, has the highest rate of homelessness in the country. Its rate increased by 15% from 2019 to 2022. Regarding the total number of people experiencing homelessness, California had the highest number at 171,521, followed by Washington at 25,211 and Florida at 25,959.
On the other hand, North Dakota had the lowest number of people experiencing homelessness at 610, followed by Wyoming at 648 and Mississippi at 1,196. The Midwest region of the United States generally saw small changes in its homelessness rates, suggesting a relatively stable rate of homelessness compared to other regions.
New Mexico had the highest decrease in total homelessness per 10k, with a percentage change of -22%, followed by Idaho and New York, with percentage changes of -20%.
Unsheltered Homelessness
One of the most striking findings from the data is the high rate of unsheltered individuals, with 40% of people experiencing homelessness in 2022. The percentage of unsheltered individuals increased by 9% from 2019 to 2022.
Unsheltered homelessness increased in several states, including Rhode Island, North Dakota, and New Mexico. The highest percentage of unsheltered homelessness was in California, with 67% of the homeless population being unsheltered. Vermont had the lowest percentage of unsheltered homelessness at 2%.
Emergency Shelter
Emergency shelters are critical in addressing homelessness in the United States. Emergency shelters are temporary housing options for individuals and families experiencing homelessness, providing immediate assistance and basic needs such as food, shelter, and safety. The percentage of emergency shelters decreased by 1% from 2019 to 2022.
Emergency shelter usage increased in several states, including Louisiana, Montana, and Nevada. The states with the highest percentage of emergency shelter use were Vermont, New York, and Delaware. In contrast, the states with the lowest rate of emergency shelter use were Hawaii, California, and Mississippi.
Transitional Housing
The percentage of transitional housing decreased by 19%, a worrying trend.
The percentage change in transitional housing varied widely across states, with some states experiencing significant decreases while others saw minimal increases. Mississippi had a -56% change, while Tennessee had a -47% change. The only four states that saw an increase in transitional housing were West Virginia (22%), South Dakota (13%), Utah (5%), and Maine (4%).
Vermont had the lowest percentage of individuals in transitional housing in 2022 at 4%, followed by Louisiana (6%) and New York (6%). Kansas had the highest rate of 24%, second was Iowa (23%) and Maine (22%).
In conclusion, the data on homelessness in the United States in 2022 highlights the urgent need for comprehensive, coordinated solutions to this complex issue. This includes partnerships between government agencies, non-profit organizations, faith communities, and other stakeholders, as well as meaningful engagement with individuals and families experiencing homelessness.
Methodology:
The data used for this report comes from the Annual Homeless Assessment Report (AHAR) released by the United States Department of Housing and Urban Development (HUD). The report provides information on the number of people experiencing homelessness on a single night in January and trends over time. The data covers three categories of homelessness: unsheltered, in emergency shelters, and transitional housing. The analysis includes the percentage change in each type of homelessness from 2019 to 2022 and the total homelessness rate per 10,000 people in each state in 2022.
Article Search
Share
All Article Categories


