Cities With the Largest Wealth Gains From Home Ownership

Specializes in providing actionable insights into the commercial real estate space for investors, brokers, lessors, and lessees. He covers quarterly market data reports, investment strategies, how-to guides, and top-down perspectives on market movements.

The American real estate market has seen a significant share of turbulence, but the two years following the pandemic saw the sector achieve historic gains. Now that the real estate market is starting to stabilize thanks to the Fed’s fight against inflation, the economic aftermath of its recent trailblazing is worth examining.
The report shows which cities have seen the greatest gains of wealth due to the appreciation of home values. It highlights the top 25 cities in the United States with the most significant increase in the value of homes over the last five years.
The data shows a positive trend in housing wealth gains over the previous five years in the United States, with many cities experiencing significant appreciation in the value of their homes.
Read on to discover which metros have seen the most wealth appreciation due to homeownership over the past five years.
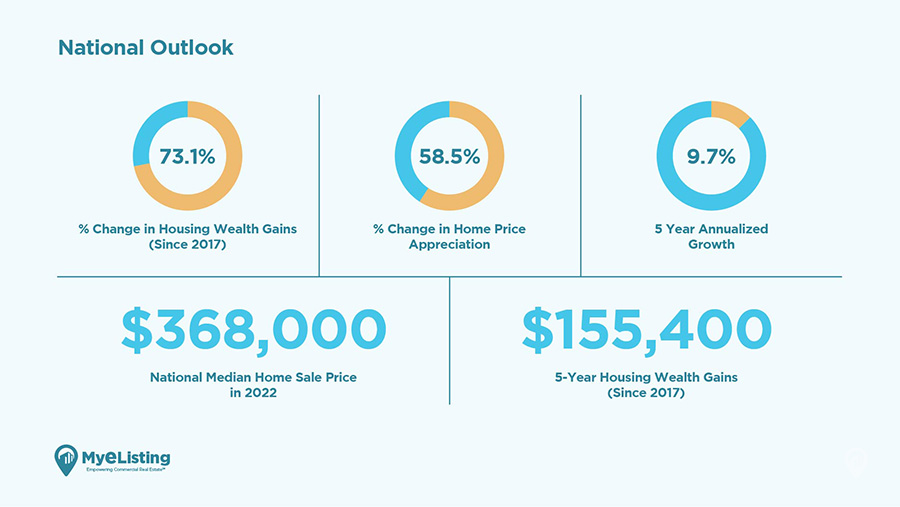
National Outlook:
- National Median Home Sales Price in 2022: $368,000,
- 5-Year Housing Wealth Gains (Since 2017): $155,400,
- % Change in Housing Wealth Gains (Since 2017): 73.1%,
- % Change in Home Price Appreciation: 58.5%,
- 5-Year Annualized Growth: 9.7%.

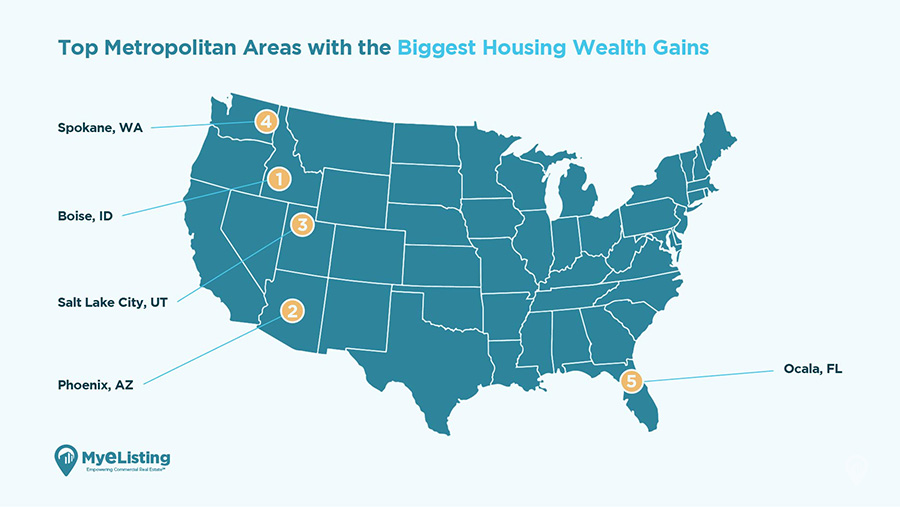
Top Metropolitan Areas with the Biggest Housing Wealth Gains
Here are the top 5 cities with the most significant percentage increase in housing wealth:

#1 – Boise City-Nampa, ID
- Median Sales Price in 2022: $491,400;
- 5-Year Housing Wealth Gains (Since 2017): $301,200;
- % Change in Housing Wealth Gains: 158.4%;
- % Change Home Price Appreciation: 136.6%;
- 5-Year Annualized Growth: 18.8%.
#2 – Phoenix-Mesa-Scottsdale, AZ
- Median Home Sales Price in 2022: $474,500;
- 5-Year Housing Wealth Gains (Since 2017): $256,600;
- % Change in Housing Wealth Gains: 117.8%;
- % Change Home Price Appreciation: 99.5%;
- 5-Year Annualized Growth: 14.8%.
#3 – Salt Lake City, UT
- Median Home Sales Price in 2022: $556,900;
- 5-Year Housing Wealth Gains (Since 2017): $296,100;
- % Change in Housing Wealth Gains: 113.5%;
- % Change Home Price Appreciation: 95.5%;
- 5-Year Annualized Growth: 14.4%.
#4 – Ocala, FL
- Median Home Sales Price in 2022: $267,400;
- 5-Year Housing Wealth Gains (Since 2017): $141,100;
- % Change in Housing Wealth Gains: 111.7%;
- % Change Home Price Appreciation: 93.9%;
- 5-Year Annualized Growth: 14.2%.
#5 – Spokane-Spokane Valley, WA
- Median Home Sales Price in 2022: $404,300;
- 5-Year Housing Wealth Gains (Since 2017): $212,200;
- % Change in Housing Wealth Gains: 110.5%;
- % Change Home Price Appreciation: 92.8%;
- 5-Year Annualized Growth: 14.0%.
While these cities experienced the most significant increases in housing wealth, it’s important to note that other cities also saw substantial gains.
For example:
- Las Vegas-Henderson-Paradise, NV, had a 109.5% increase and a 5-year housing wealth gain of $241,000,
- Atlanta-Sandy Springs-Marietta, GA, saw increases of 109.3%,
- and Austin-Round Rock, TX, increased by 108.1%.
Top 25 Cities Data
Here is the full table of the top 25 metros with the most significant percentage increase in housing wealth gains over the last five years:
| Rank | Metropolitan Area | 5-Year Housing Wealth % Gains | 5 Years Housing Wealth Gains $ | Median Home Sales Price 2023 | 5-Year Annualized Home Price Growth |
|---|---|---|---|---|---|
| -- | USA | 73% | $155,400 | $368,000 | 10% |
| 1 | Boise City-Nampa, ID | 158% | $301,200 | $491,400 | 19% |
| 2 | Phoenix-Mesa-Scottsdale, AZ | 118% | $256,600 | $474,500 | 15% |
| 3 | Salt Lake City, UT | 114% | $296,100 | $556,900 | 14% |
| 4 | Ocala, FL | 112% | $141,100 | $267,400 | 14% |
| 5 | Spokane-Spokane Valley, WA | 110% | $212,200 | $404,300 | 14% |
| 6 | Las Vegas-Henderson-Paradise, NV | 109% | $241,000 | $461,100 | 14% |
| 7 | Atlanta-Sandy Springs-Marietta, GA | 109% | $182,900 | $350,300 | 14% |
| 8 | Austin-Round Rock, TX | 108% | $280,900 | $540,700 | 14% |
| 9 | Lakeland-Winter Haven, FL | 108% | $166,100 | $320,000 | 14% |
| 10 | Punta Gorda, FL | 107% | $194,700 | $376,000 | 14% |
| 11 | Knoxville, TN | 105% | $157,400 | $307,900 | 13% |
| 12 | Atlantic City-Hammonton, NJ | 103% | $154,500 | $304,100 | 13% |
| 13 | Reno, NV | 103% | $301,800 | $595,200 | 13% |
| 14 | Decatur, AL | 103% | $120,200 | $237,400 | 13% |
| 15 | Fayetteville-Springdale-Rogers,AR-MO | 101% | $153,900 | $306,900 | 13% |
| 16 | Tampa-St.Petersburg-Clearwater, FL | 100% | $189,900 | $379,900 | 13% |
| 17 | Durham-Chapel Hill, NC | 99% | $208,400 | $418,000 | 13% |
| 18 | Deltona-Daytona Bch-Ormond Beach, FL | 99% | $164,200 | $330,000 | 13% |
| 19 | Sherman-Denison, TX | 99% | $135,200 | $272,200 | 13% | 20 | Charlotte-Concord-Gastonia, NC-SC | 98% | $187,900 | $379,900 | 13% |
| 21 | Pensacola-Ferry Pass-Brent, FL | 98% | $155,800 | $315,500 | 13% |
| 22 | Eugene, OR | 97% | $218,700 | $443,800 | 13% |
| 23 | Kingston, NY | 97% | $178,200 | $362,300 | 13% |
| 24 | North Port-Sarasota-Bradenton, FL | 97% | $236,000 | $480,000 | 13% |
| 25 | Winston-Salem, NC | 97% | $128,300 | $261,200 | 13% |
Median Home Prices
Median home price is one of the most important performance indicators of a given region’s real estate market. The median home price in the United States was $368,000 in 2022, a significant increase from previous years. Several factors, including low interest rates, strong economic growth, and rising demand from homebuyers have driven this growth.
Housing Wealth Gains
Growth in housing wealth gains is continuing to drive the real estate market. The five-year housing wealth gains since 2017 in the United States were $155,400, representing a 73.1% increase. Rising home prices and cumulative principal payments have driven this increase.
Price Appreciation
Price appreciation has also significantly affected the real estate market. Over the past five years, price appreciation was 58.5%, representing an annualized growth of 9.7%.
The metropolitan areas with the most significant price appreciation increases include:
- Boise City-Nampa, ID, with an increase of 136.6%,
- Phoenix-Mesa-Scottsdale, AZ, with an increase off 99.5%,
- Salt Lake City, UT, with an increase of 95.5%,
- Ocala, FL, with an increase of 93.9%.
Annualized Growth Rate
Another aspect to consider is the annualized growth rate of housing wealth, which is the average yearly gain in housing wealth. According to the data we parsed, the US housing market had an annualized growth rate of 9.7% per year over the last 5 years.
The city with the highest annualized growth rate is Boise City-Nampa, ID, with 18.8% which suggests the housing market there has been growing faster than in other cities in the USA. . Phoenix, AZ took second, with an annualized growth rate of 148%. Third was Salt Lake City, UT, which had an annualized growth rate of 14.4%.
This data illustrates that the housing market has grown significantly over the last five years, with many metropolitan areas experiencing substantial increases in median home prices and housing wealth gains. The top 25 cities ranked by housing wealth gains percentage saw an average increase of over 100% since 2017. This increase highlights the solid and sustained growth in the housing market, driven by factors such as low interest rates, strong job growth, and limited inventory.
This data suggests that the housing market continues to be a substantial investment opportunity for those looking to build wealth through homeownership. It also provides insight into the ranking of metropolitan areas based on housing wealth gains and the growth of home prices over the past 5 years. We hope this information can be helpful for individuals and businesses investing in real estate in these metropolitan areas.
Methodology:
The MyEListing team calculated Housing Wealth Gains by adding the cumulative principal payments and the price appreciation over the specified years. Data was collected and ranked based on the percentage increase in Housing Wealth Gains in the United States metropolitan areas.D was sourced from the National Association of REALTORS® Report on Housing Wealth Gains on a Typical Single-Family Existing-Home as of 2022 Q1.
Article Search
Share
All Article Categories


